Bitcoin Technical Analysis: BTC/USD bulls do not be fooled and lured into the bears trap
- Bitcoin is nursing losses just shy of 2% in the session, after receiving a beating during the Asian session.
- BTC/USD has been allowed a small pullback from the overnight lows, catching support in the demand zone, $5900-800.

BTC/USD 30-minute chart
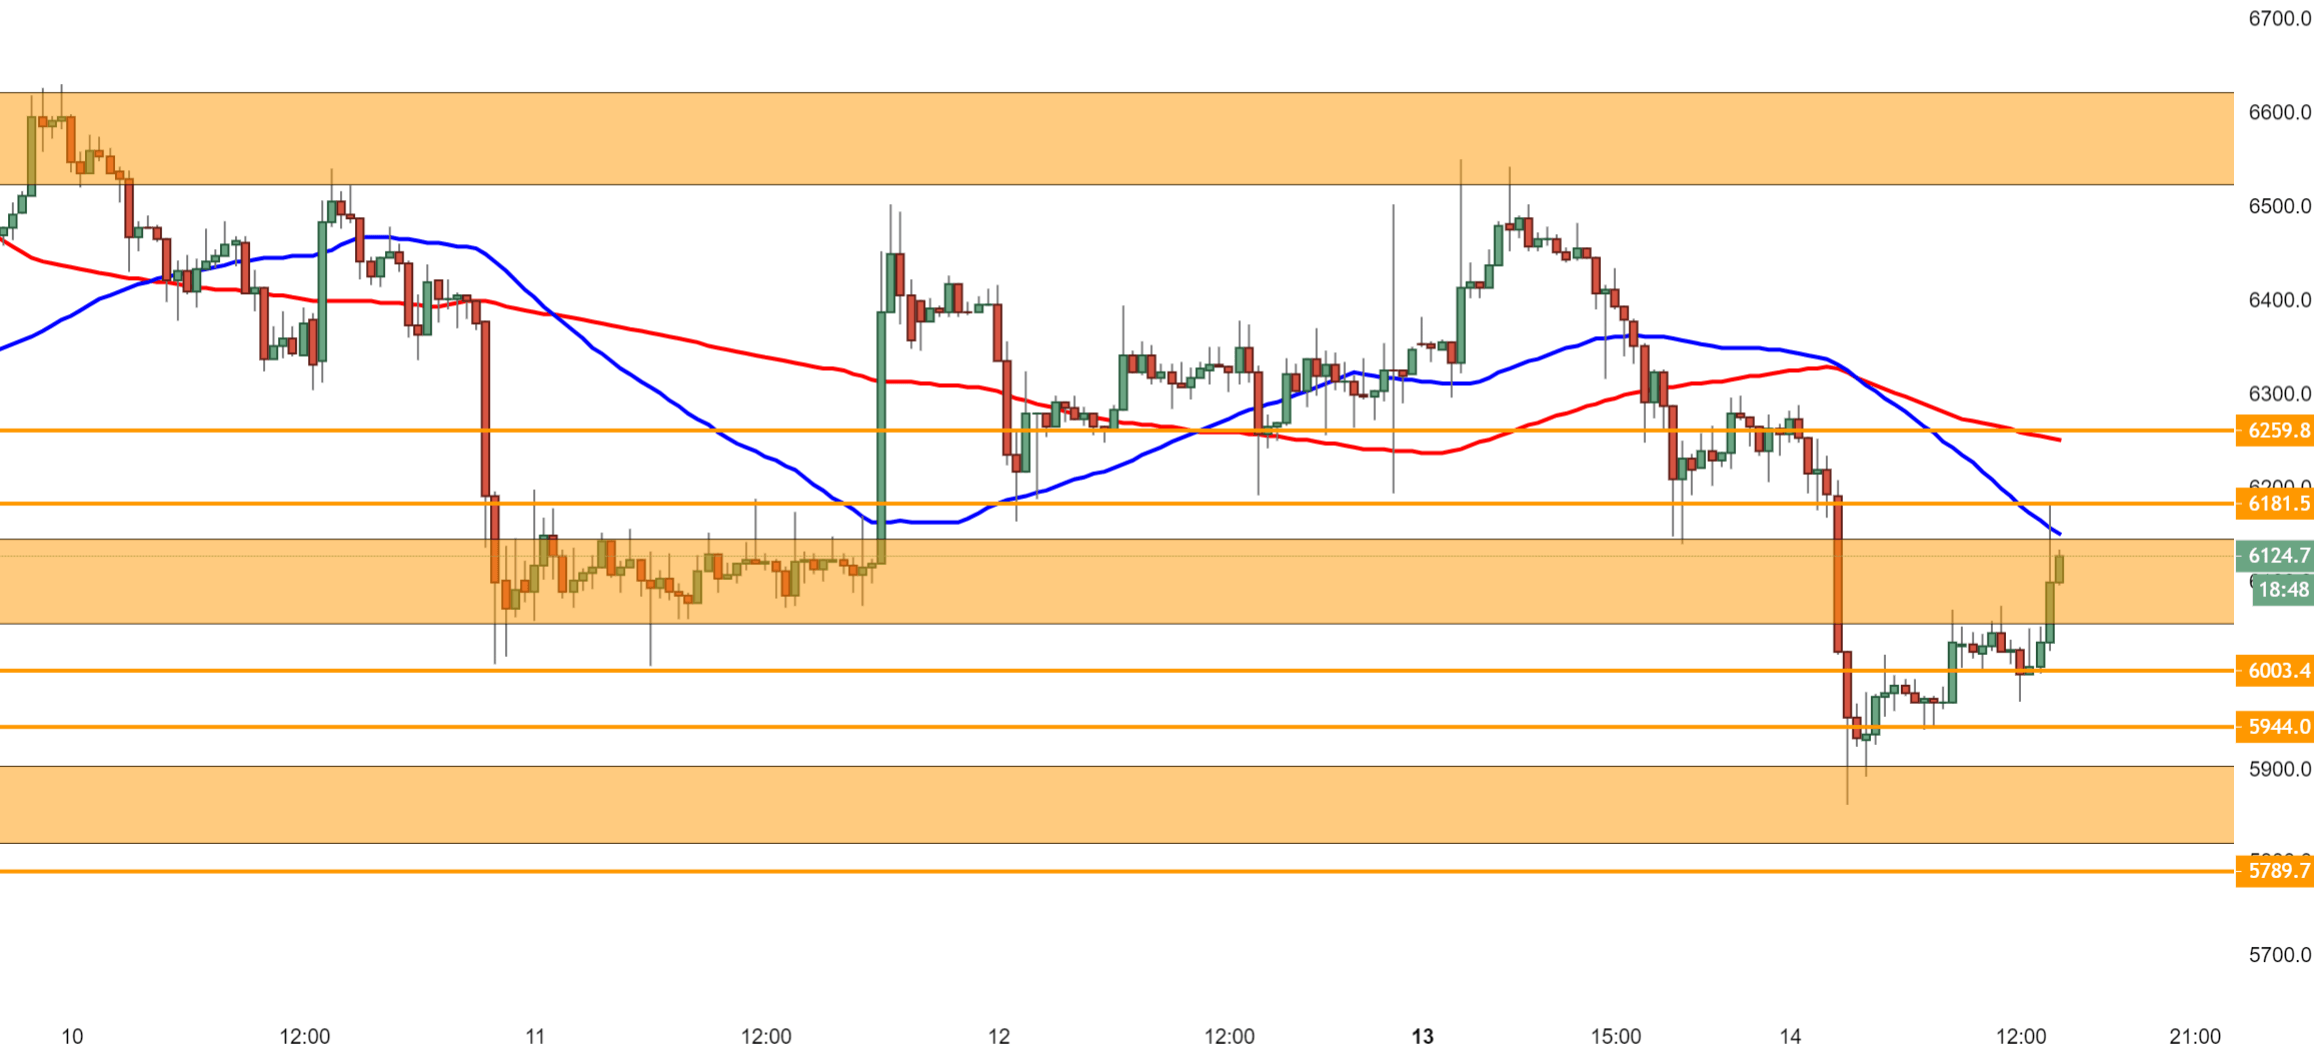
Spot rate: 6124.0.
Relative change: - 1.90%
High: 6251.9
Low: 5858.6
Trend: Bearish
Support 1: 6003.4, (support on 30-minute chart).
Support 2: 5944.0, consolidation area of today (Tuesday).
Support 3: 5900-800, demand zone.
Resistance 1: 6181.5, 50MA.
Resistance 2: 6259.8, 100MA.
Resistance 3: 6500.0, psychological resistance & supply zone.
Author

Ken Chigbo
Independent Analyst
Ken has over 8 years exposure to the financial markets. He started his career as an analyst, covering a variety of asset classes; forex, fixed income, commodities and equities.
More from Ken Chigbo


