Bitcoin Technical Analysis: BTC/USD bullish flag structure subject to break higher
- Bitcoin price trading up with modest gains of some 0.40% in the second half of Tuesday.
- BTC/USD price action via the 4-hour chart view, has formed a bullish flag pattern.

BTC/USD 15-minute chart
- Near-term price action has made a breakout above a descending trend line formation.
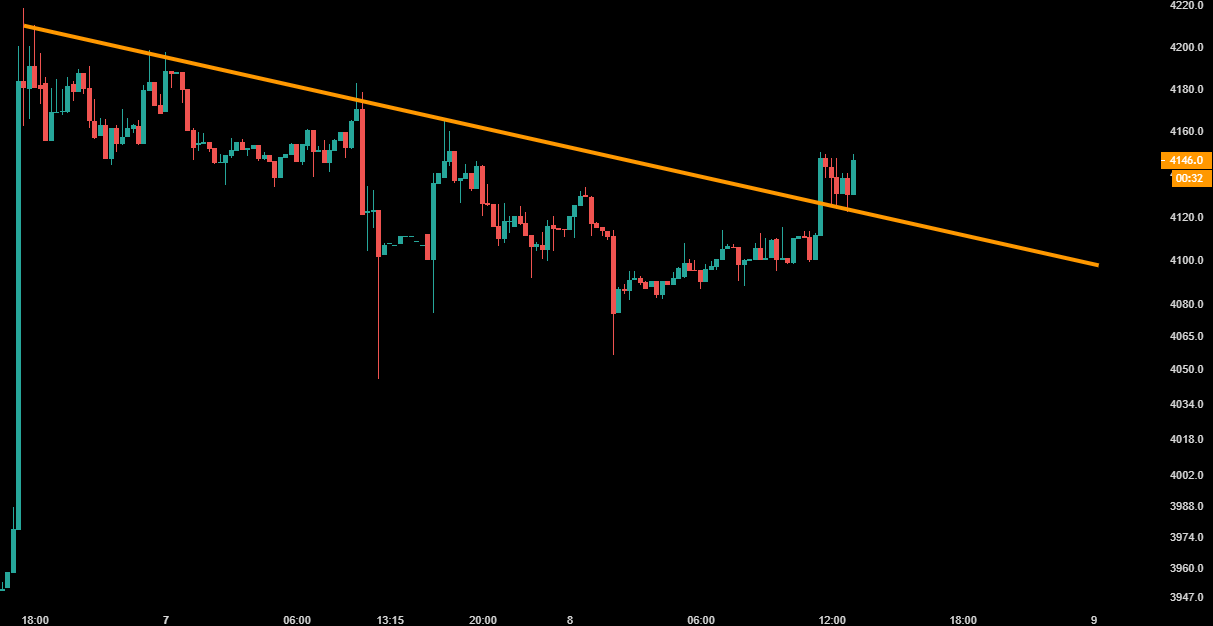
Spot rate: 4143.5
Relative change: +0.45%
High: 4149.9
Low: 4056.0
Trend: Neutral
Support 1: 3977.46, daily pivot point support.
Support 2: 3948.19, daily pivot point support.
Support 3: 3918.38, daily pivot point support.
Resistance 1: 4036.54, daily pivot point resistance.
Resistance 2: 4066.35, daily pivot point resistance.
Resistance 3: 4095.62, daily pivot point resistance.
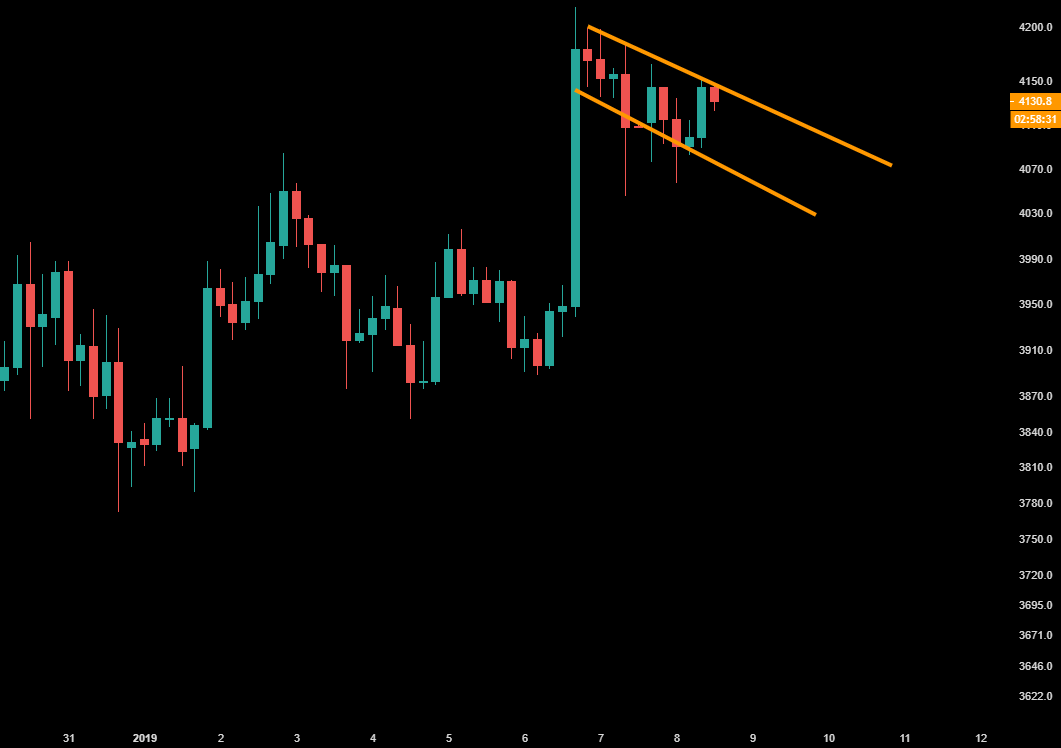
BTC/USD 4-hour chart
- Price action is moving within a bullish flag pattern formation, via the 4-hour.
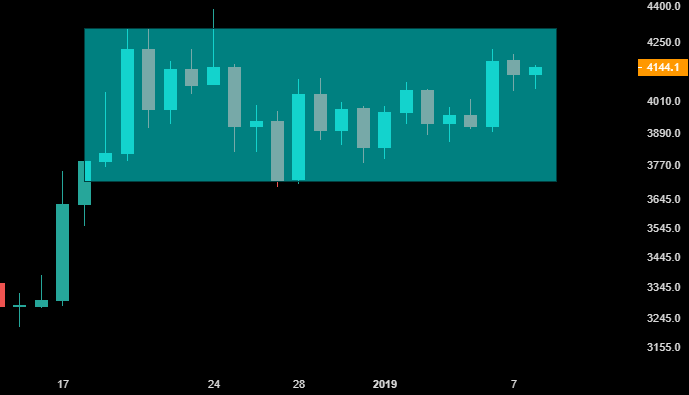
BTC/USD daily chart
- The price has been unable to escape from a range-block, seen from $3600-4300.
Author

Ken Chigbo
Independent Analyst
Ken has over 8 years exposure to the financial markets. He started his career as an analyst, covering a variety of asset classes; forex, fixed income, commodities and equities.


