Bitcoin Technical Analysis: BTC/USD big bulls are back, but can they break $4000 again?
- Bitcoin price on Monday was seen holding gains of over 4% in the second half of the session.
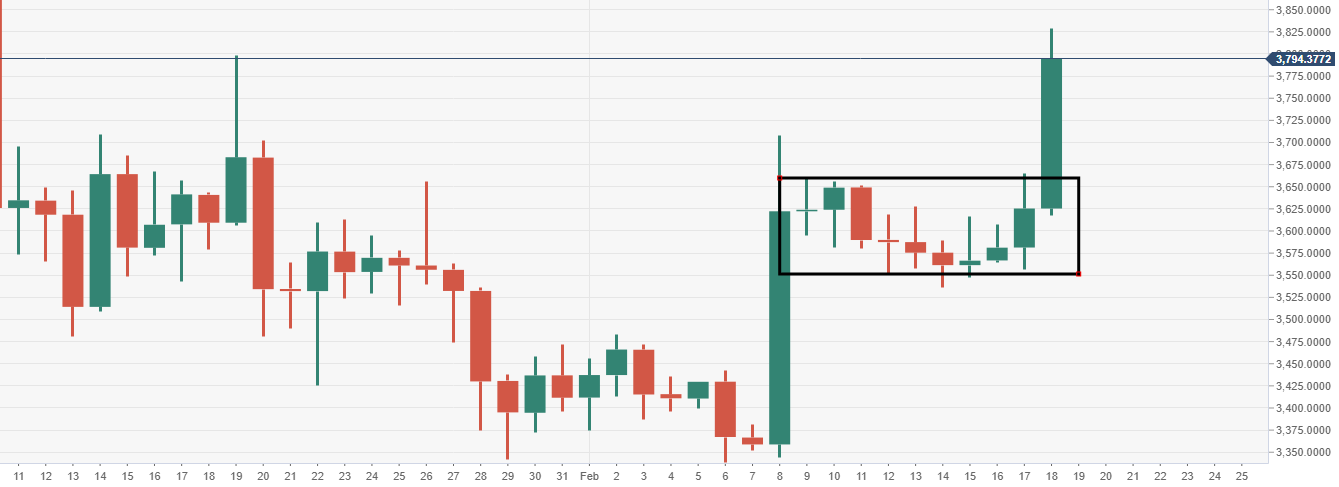
- A wave of buying pressure has come into play, thanks to a breakout from a narrowing daily range formation.

Spot rate: 3801.34
Relative change: +4.25%
High: 3829.27
Low: 3617.55
Trend: Bullish
Support 1: 3566.51, daily pivot point support.
Support 2: 3507.64, daily pivot point support.
Support 3: 3458.57, daily pivot point support.
Resistance 1: 3674.46, daily pivot point resistance.
Resistance 2: 3723.53, daily pivot point resistance.
Resistance 3: 3782.4, daily pivot point resistance.
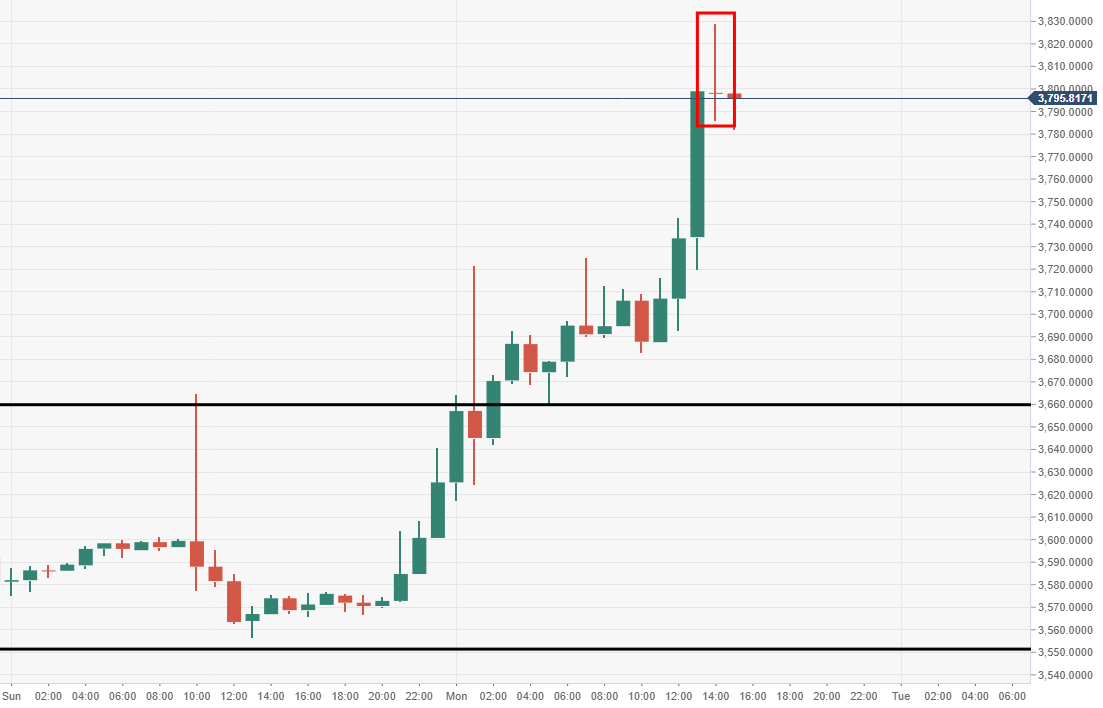
BTC/USD 60-minute chart
- Bearish doji candlestick seen via the 60-minute, suggesting of a possible pullback.
BTC/USD daily chart
Author

Ken Chigbo
Independent Analyst
Ken has over 8 years exposure to the financial markets. He started his career as an analyst, covering a variety of asset classes; forex, fixed income, commodities and equities.


