Bitcoin Technical Analysis: BTC/USD bearish pennant pattern subject to a breakout
- Bitcoin price in the second half on Thursday is nursing losses of around 0.95%.
- BTC/USD price action remains within consolidation mode, following a breakout of a critical daily supporting trend line at the start of the week.
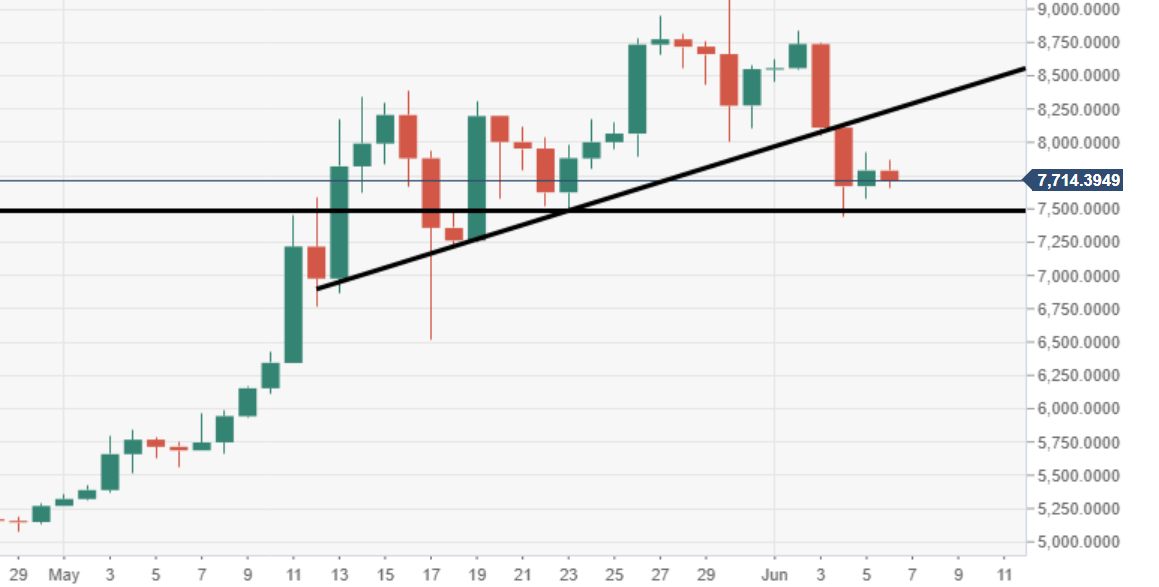
- Big near-term daily support is seen at $7500 level, a break below would heavily expose $7000 to the downside.

Spot rate: 7,725.41
Relative change: -0.95%
High: 7873.40
Low: 7653.96
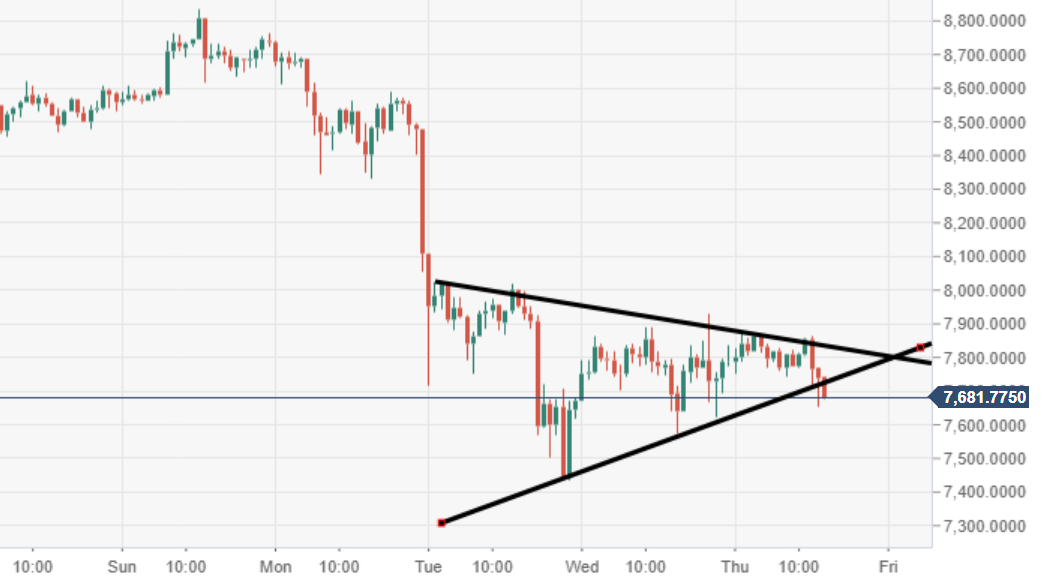
BTC/USD 60-minute chart
- Price action via the 60-minute chart view is moving within a bearish penannt pattern structure, subject to further potential downside.
BTC/USD daily chart
- Consolidation mode is observed via the daily chart, following the trend line break earlier in the week.
Author

Ken Chigbo
Independent Analyst
Ken has over 8 years exposure to the financial markets. He started his career as an analyst, covering a variety of asset classes; forex, fixed income, commodities and equities.
More from Ken Chigbo


