Bitcoin technical analysis: BTC/USD $10,500 is the big bull target to breakdown
- Bitcoin price in the session on Friday is trading with minor losses of some 0.90%.
- BTC/USD price remains largely capped to the upside, narrowing further in its daily range.
- The price as mentioned previously continues to move within the confinements of a narrowing triangular structure.
- There continues to be lack of commitment for now in terms of trend, as the price further consolidates.

Spot rate: 10,309.31
Relative change: -0.90%
High: 10,454.53
Low: 10,287.82
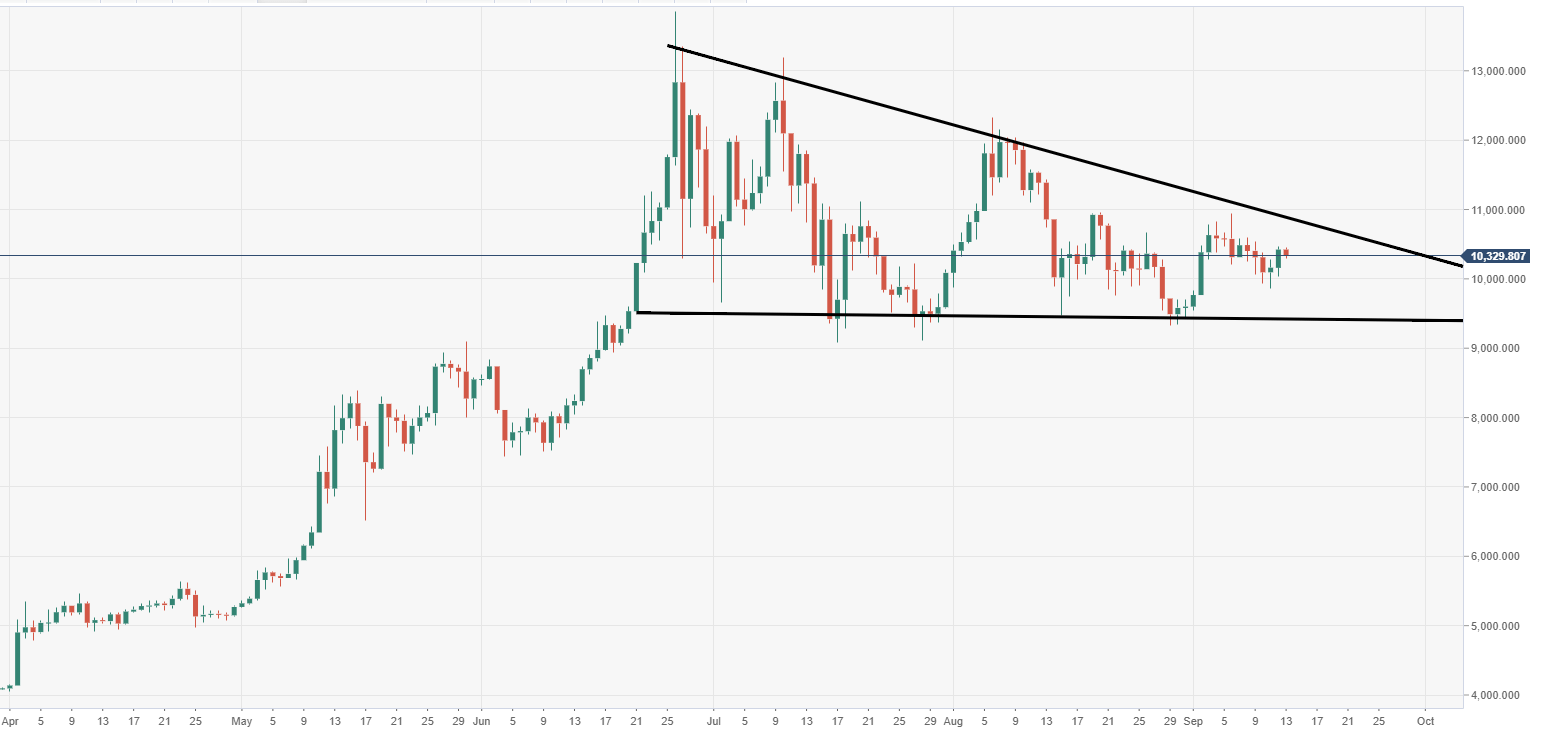
BTC/USD daily chart
- BTC/USD daily price action is limited at present, with the lack of trend commitment. The price has recently edged out of a bullish flag structure, making room for further potential upside.

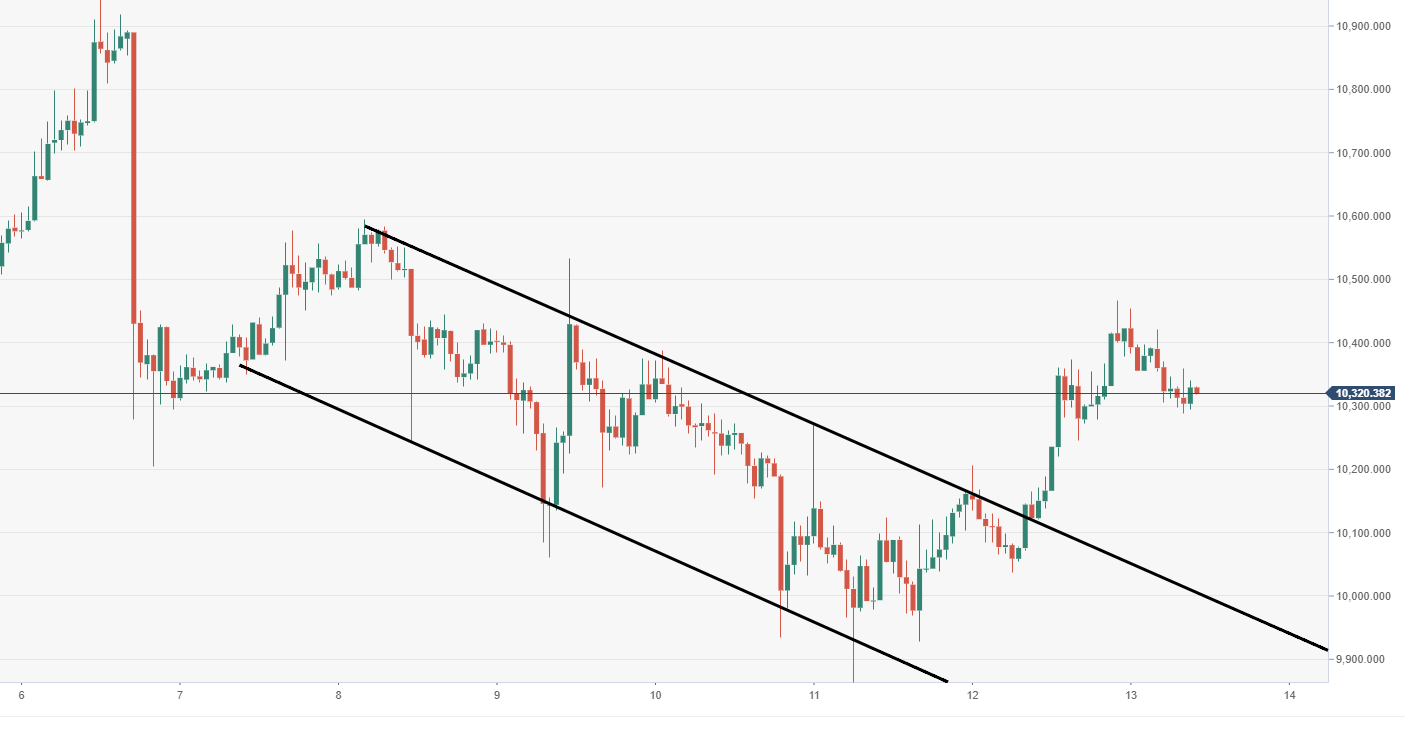
BTC/USD 60-minute chart
- Near-term price action via the 60-minute chart view has made some progress, after breaking out from a descending channel structure.
Author

Ken Chigbo
Independent Analyst
Ken has over 8 years exposure to the financial markets. He started his career as an analyst, covering a variety of asset classes; forex, fixed income, commodities and equities.
More from Ken Chigbo


