Bitcoin remarkably swings higher despite long term holders offloading their coins
- Bitcoin long-term holders realizing profit is not a bearish signal; instead, it has long been a market driver.
- BTC LTH supply in profit tends to reduce before the market spikes to the top.
- BTC/USD is likely to continue posting gains, but it isn't easy to foresee how nigh the market top is.

Bitcoin is generally trending higher in spite of the seller congestion at $19,500. Intriguingly, on-chain metrics suggest that long-term holders of BTC are busy offloading their wallets, perhaps to realized profits. However, instead of this activity, sending bearish waves across the cryptocurrency market continues to paint a bullish picture for Bitcoin.
Why Bitcoin remains bullish as long term holders sell?
Glassnode, a renowned platform for on-chain analysis, uses different tools and indicators to highlight that older, mostly dormant coins are currently in the movement even as Bitcoin price rises.
For instance, Bitcoin Entity-Adjusted Average Spent Output Lifespan (7-day Moving Average) chart below shows a similar spike in 2020's bull run to 2017. ASOL highlights the average age of assets that are transacting on the blockchain. A spike in the ASOL suggests that older coins are being moved, signifying that long-term investors realize profits.
The Entity-Adjusted ASOL tracks the real economic activity, ignoring in-house transactions. In-house transactions refer to the movement of coins within addresses belonging to the same entity. Therefore, this metric brings forth an improved market signal instead of the raw data from the Unspent Transaction Output (UTXO) version.
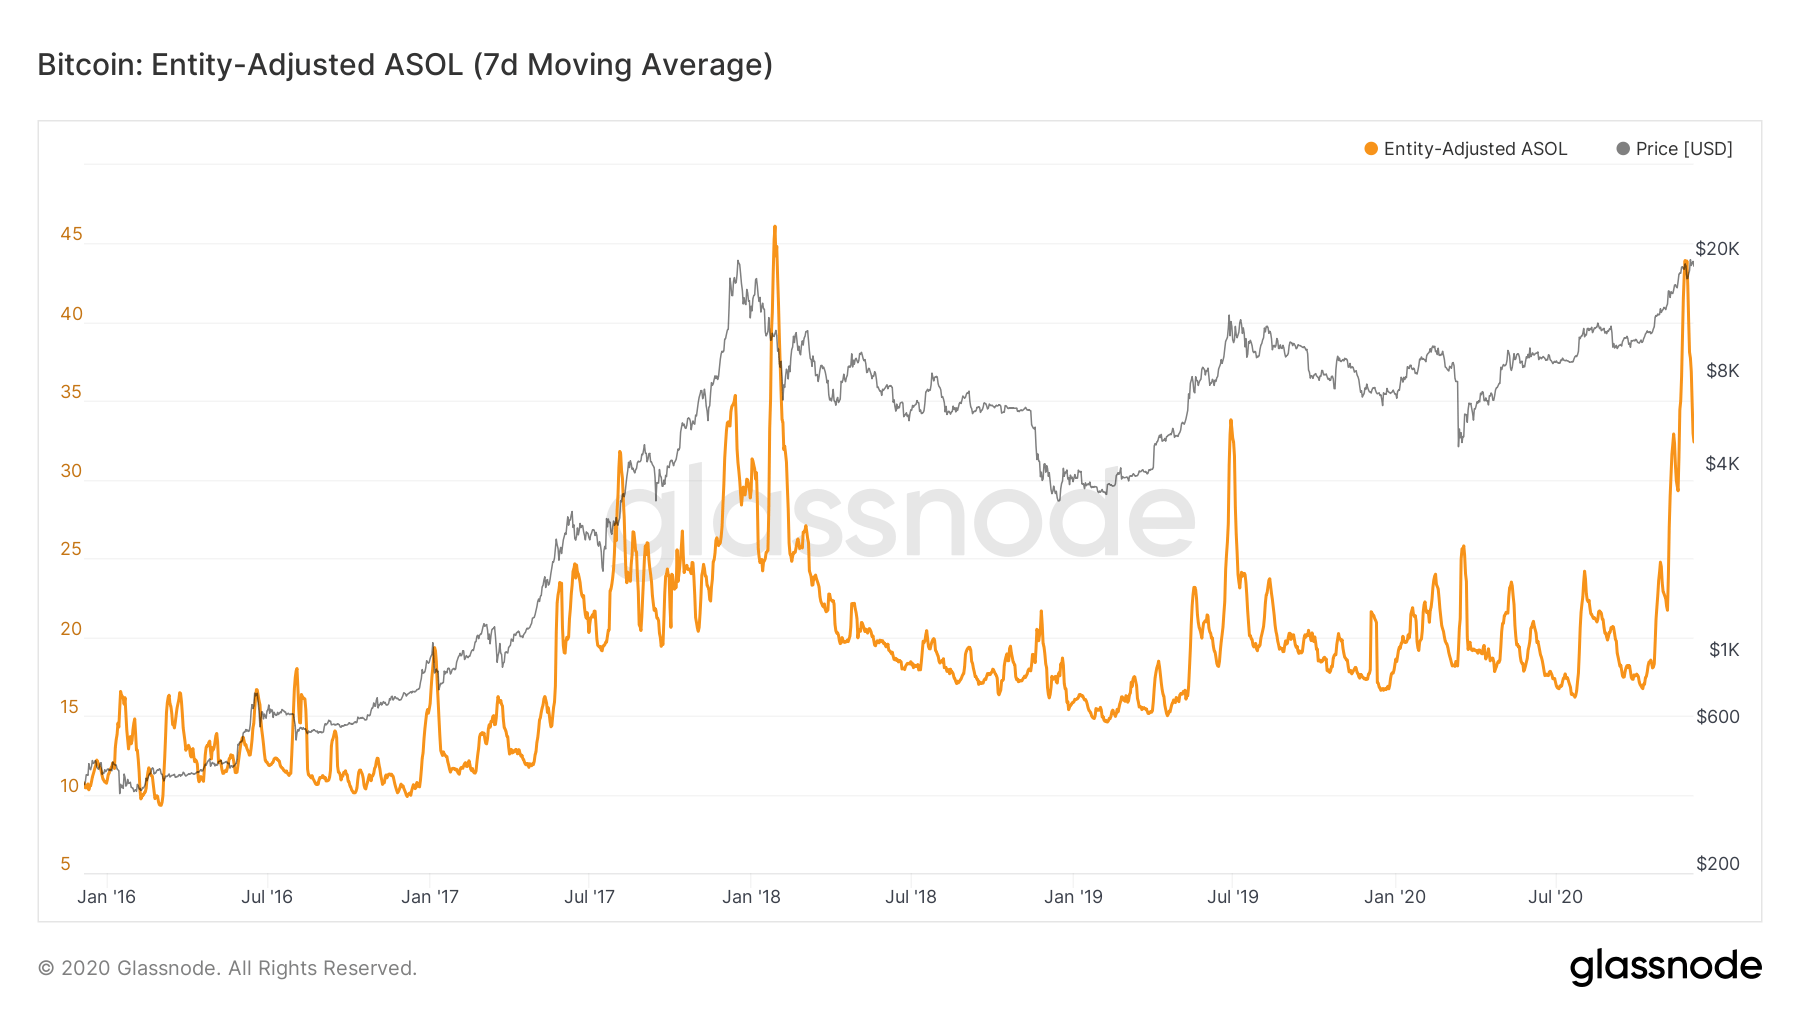
Bitcoin Entity-Adjusted ASOL chart
Bitcoin long-term holder supply in profit seems to be dwindling
Bitcoin started the bull run around July 26, 2020, on breaking the barrier at $10,000. At the time, BTC's supply in profit stood at 10.8 million. Five months later, Bitcoin has almost doubled in price, but the LTH supply in profit grew by only 1.2 million, representing 11.5%. At the moment, the metric is holding around 12.1 million.
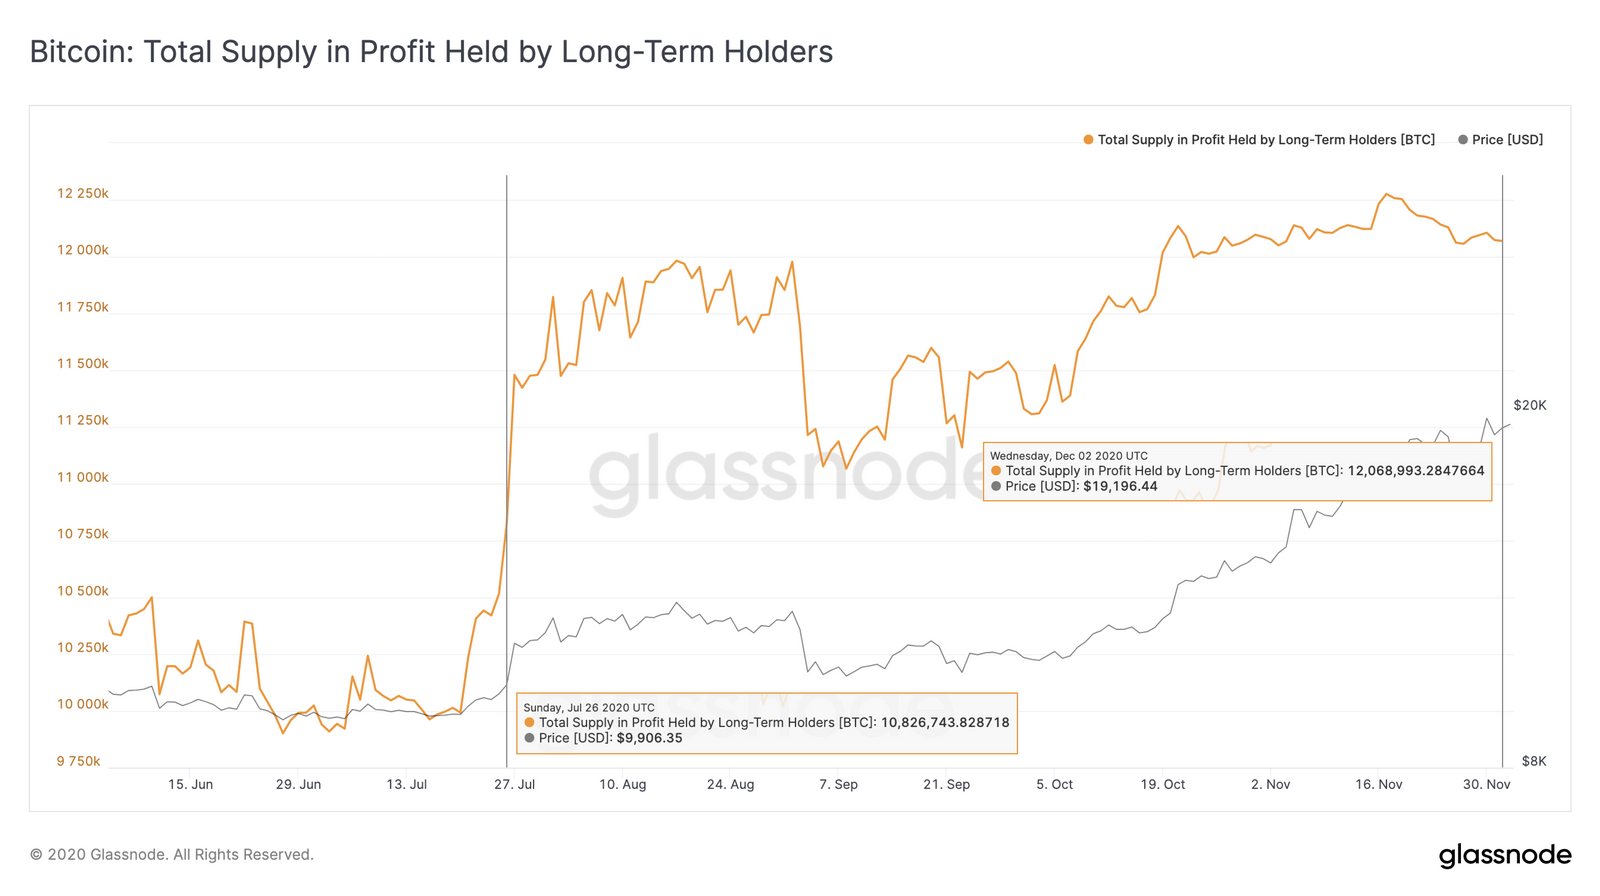
Bitcoin long-term holder supply in profit chart
It is essential to realize that the total profit has gone up considerably, supported by the price's spike. However, Bitcoin's supply in profit has not grown as much, implying that most long-term holders purchased BTC under $10,000.
In other words, they have continued to hold the coins amid the bull run. Consequently, a sharp spike in the ASOL towards the end of November indicated that some long term holders had started offloading BTC after realizing profits.
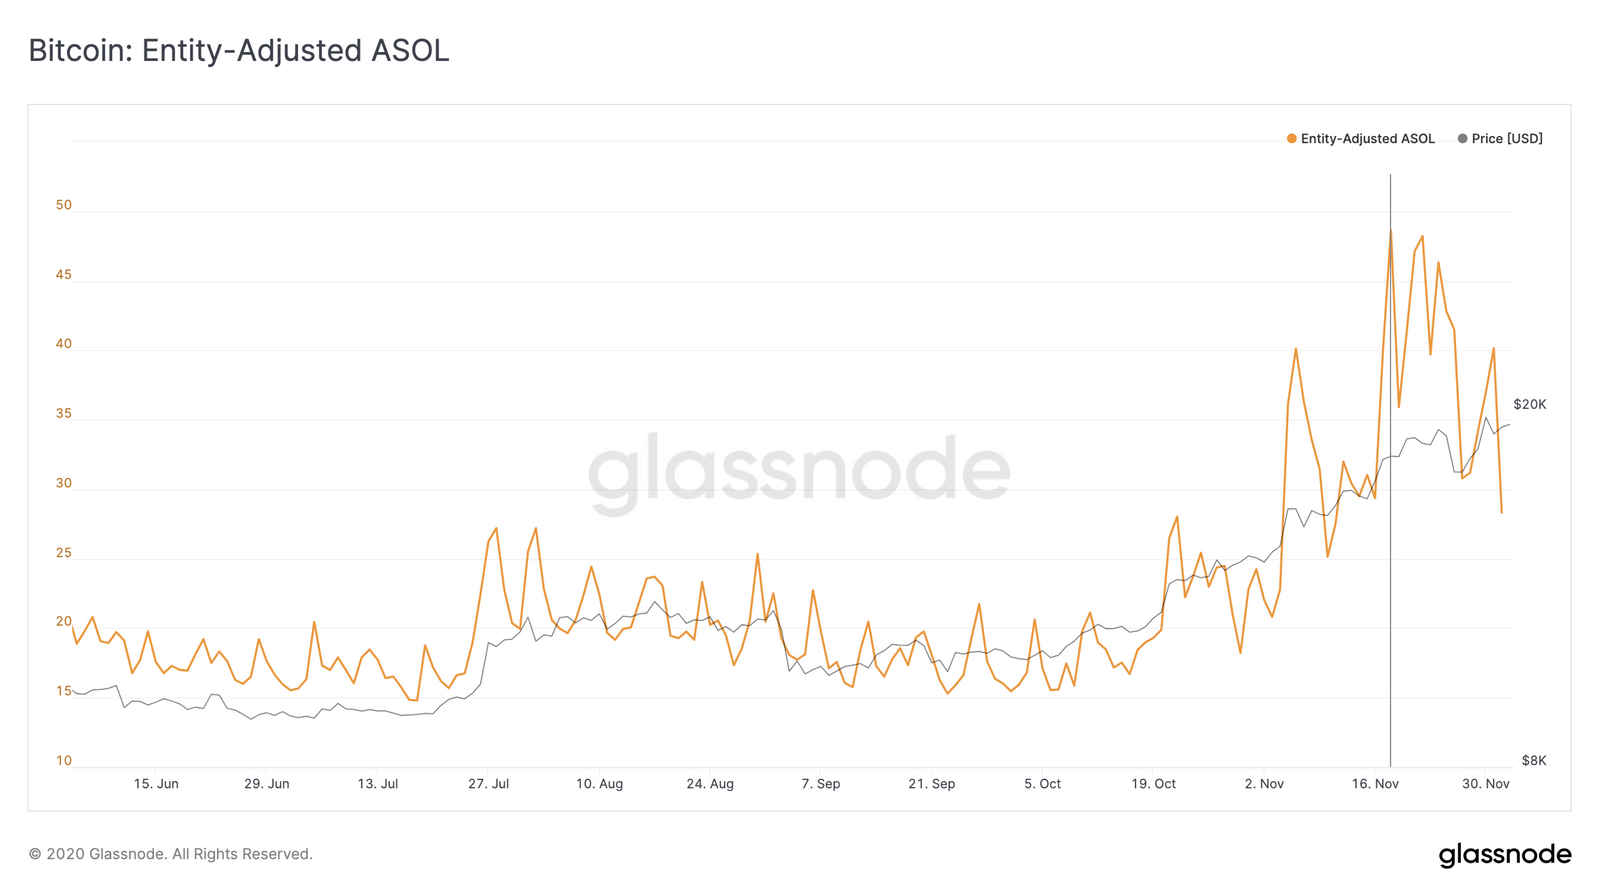
Bitcoin Entity-Adjusted ASOL at an all-time high
The spike witnessed in the Entity-Adjusted ASOL was reinforced by a significant growth in the long-term holder supply in profit, which shot up to 12.3 million around November 17. At the time, BTC exchanged hands at $17,670, but the price has since grown by 9%. On the other hand, the LTH supply in profit has reduced by approximately 200,000 BTC. This shows that despite LTH selling, Bitcoin's price continued with the rally to highs above $19,500.
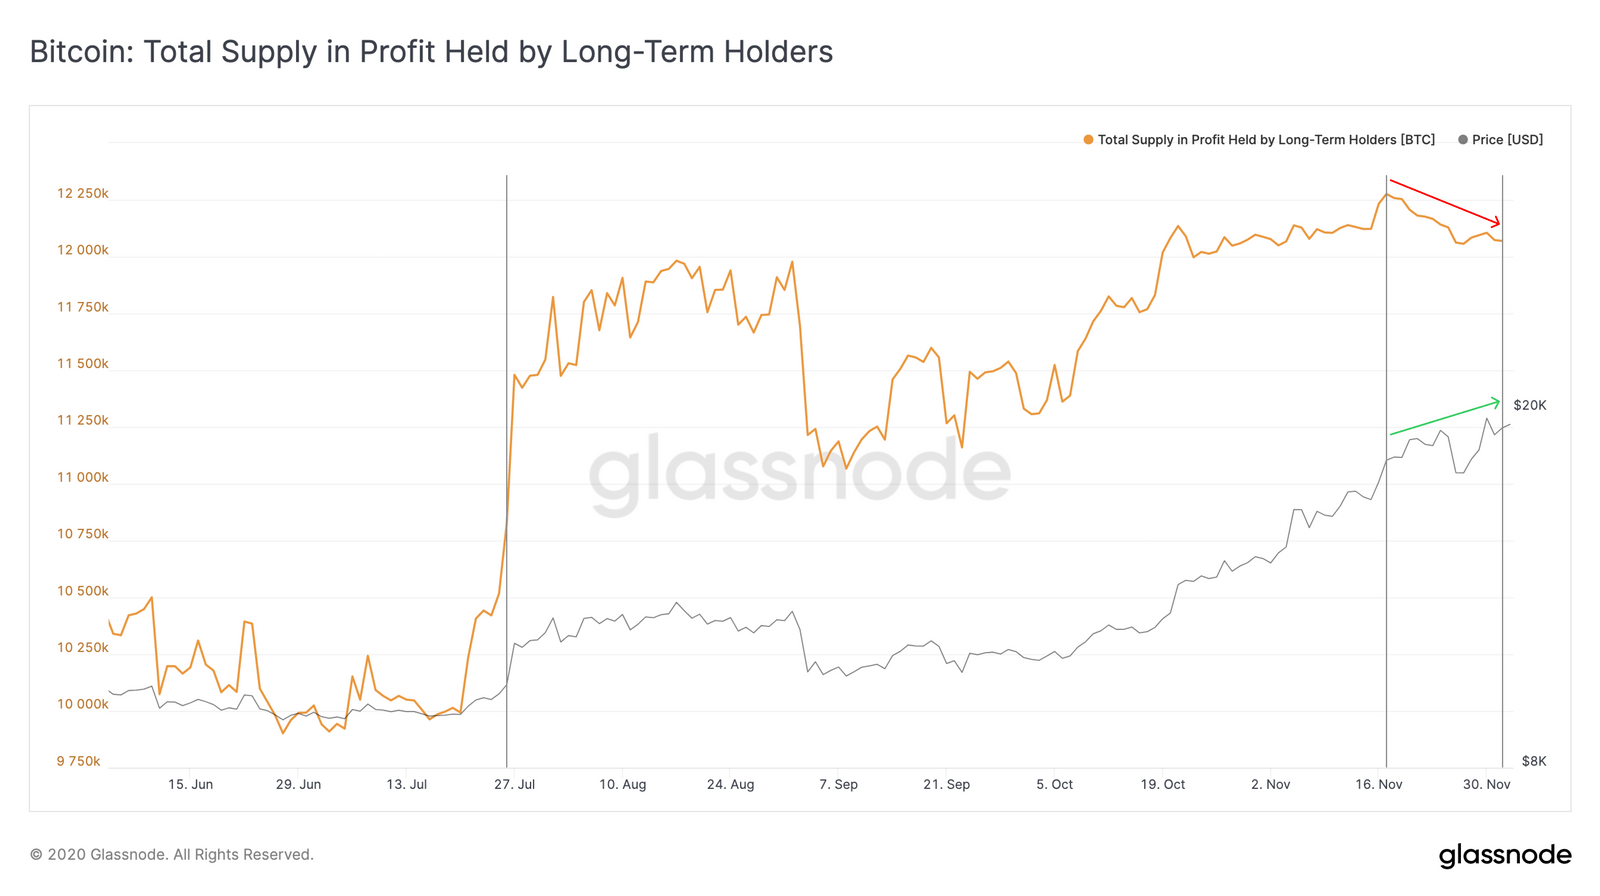
Bitcoin LTH supply in profit drops
What does this mean for the market?
It is clear that long term holders have recently been in profit, but this is not a bearish signal. Meanwhile, it is essential to note that these holders can realize profits before and during bull runs. Therefore, the trend shows that long-term holders' total supply tends to fall ahead of the market peak, similar to the LTH supply in profit.
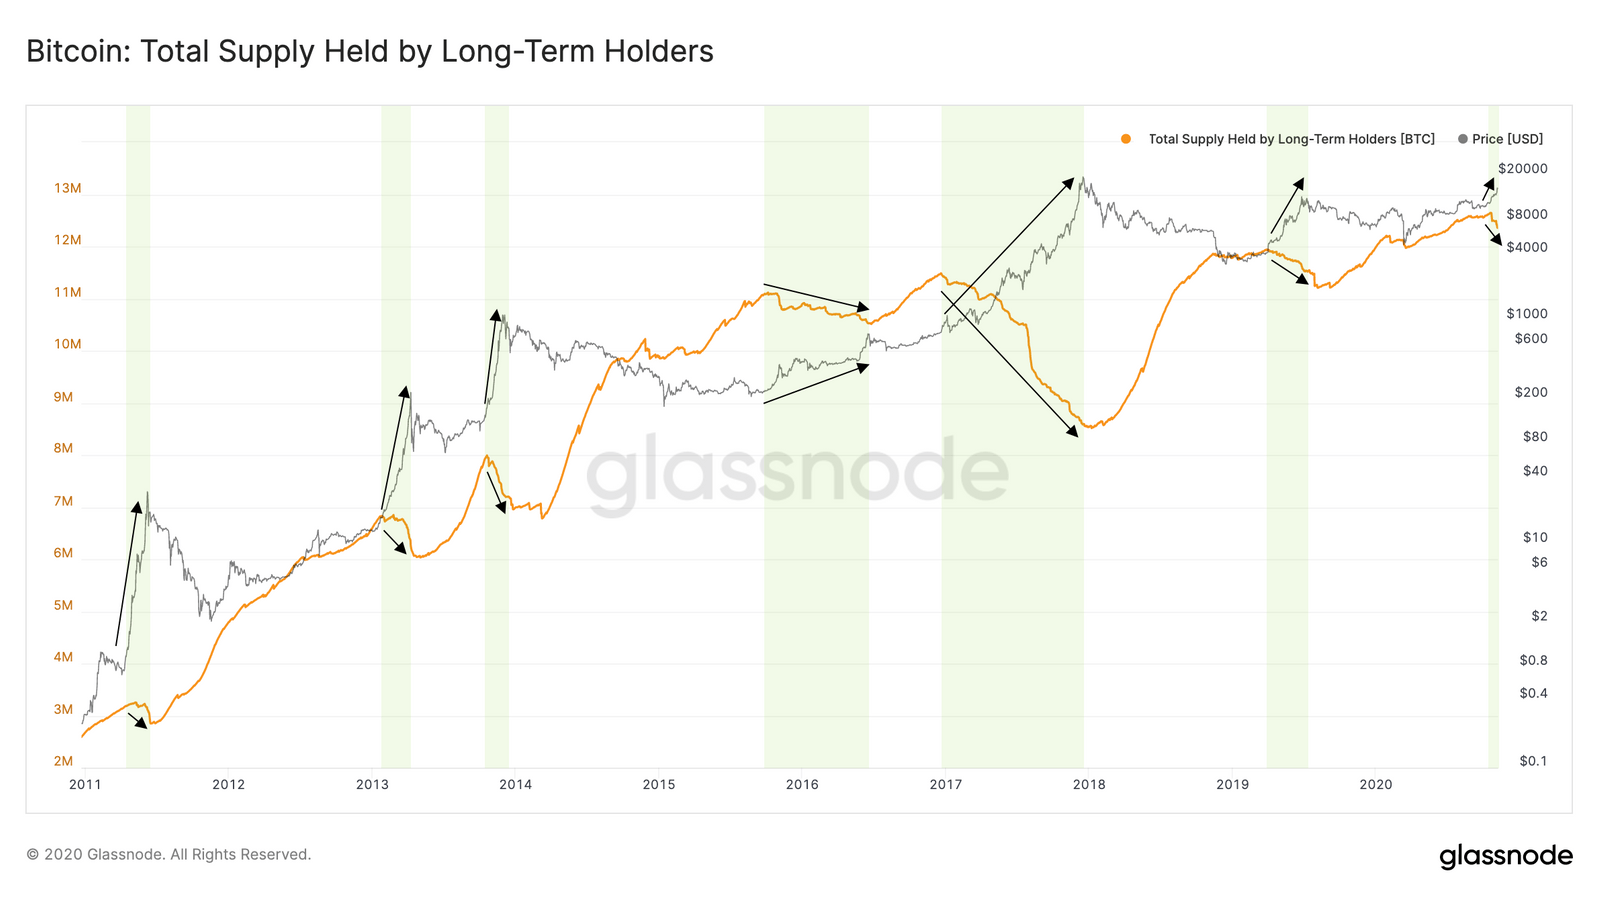
Bitcoin total supply held by long-term holders decreases before bull runs
Bitcoin price tends to rally even though long-term holders are selling because as these investors realize profits, room is created for new holders to enter the market. Long-term holders typically buy during bearish markets and start to realize profits as the market recovers. However, the analysis above shows that profit is realized before the market peak.
Unfortunately, the slump in long-term holder supply (as well as supply in profit) has in the past persisted for weeks, months, and even a year. Therefore, it is not easy to precisely speculate how far the market is from the incoming top. It is worth noting that, if history holds water, Bitcoin is likely to continue realizing gains ahead of its top.
In the meantime, Bitcoin seems to be settling in for consolidation ahead of another significant breakout. The Bollinger Bands' squeeze doubles down on this expected breakout. For now, keeping Bitcoin above $19,000 is the bulls' priority, especially with the critical hurdle at $19,500.
%20(81)-637429107359184918.png)
BTC/USD 4-hour chart
If push comes to shove and Bitcoin slides under $19,000 and the 50 Simple Moving Average, sell orders are likely to surge, creating enough volume to push Bitcoin to lower levels, probably to the 100 SMA at $18,000. Here, recovery may come into the picture after more buyers join the market.
Author

John Isige
FXStreet
John Isige is a seasoned cryptocurrency journalist and markets analyst committed to delivering high-quality, actionable insights tailored to traders, investors, and crypto enthusiasts. He enjoys deep dives into emerging Web3 tren


