Bitcoin registers more losses than profits — And that pattern may signal a floor is near
- Bitcoin sees $2.6 billion in net capital outflows over 30 days, with fresh buyers failing to absorb selling pressure.
- The realized profit/loss ratio sits at 0.25, meaning losses are being locked in four times faster than gains.
- MVRV indicates widespread losses, which typically reduces sell pressure as holders refuse to realize losses.

Bitcoin currently registers more losses than gains across its holder base. Investors who bought near recent highs are now selling at a loss, and new capital entering the market has turned negative. Over the past 30 days, roughly $2.6 billion in net capital left Bitcoin. In stronger market conditions, price dips usually attract fresh buyers. Right now, buyers are not showing up in enough force to absorb the selling.
-1770818236511-1770818236512.jpg)
The realized profit-to-loss ratio — a measure comparing how much profit holders lock in versus how much loss they realize — sat at approximately 0.25 at the time of writing. A reading below 1.0 means losses are closing faster than profits. A reading as low as 0.25 means losses outpace profits by a wide margin. Sellers dominate the current price action, and confidence among holders has pulled back sharply.
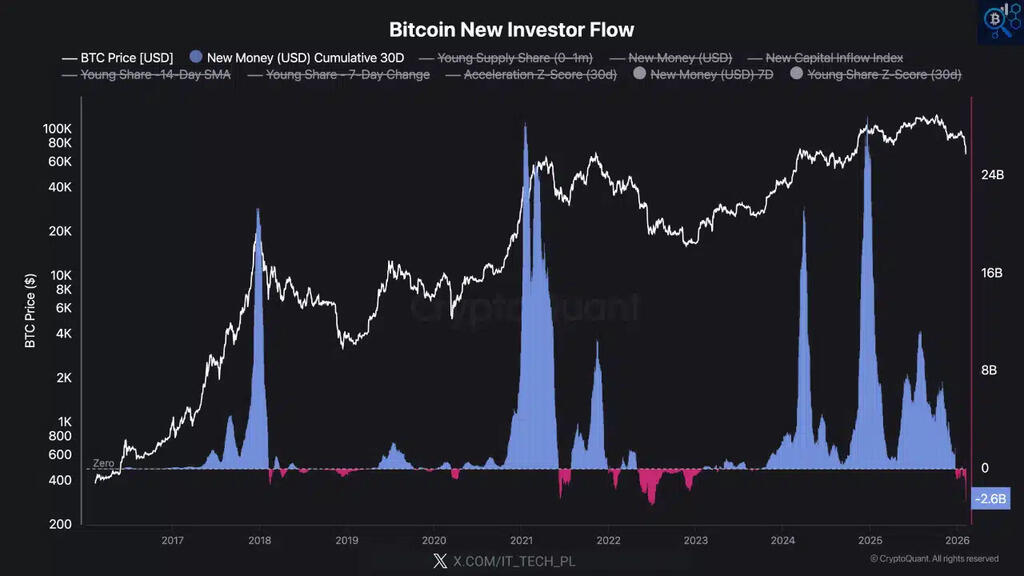
The absence of new inflows adds another layer of pressure. Capital flowing into Bitcoin from first-time or returning buyers normally cushions corrections and prevents dips from deepening too quickly. Without inflows, each downward price move meets less resistance, which makes the overall market feel heavier with each passing day.
When fear reaches its peak, the market often sits close to a local low
A recent report examined what happens to Bitcoin prices when online discussions fill with words like "crash," "sell," and similar bearish language. The findings pointed in a consistent direction: extreme fear in public conversations tends to appear just as prices approach short-term bottoms, not after they have already fallen much further.
The MVRV metric — which compares what recent buyers paid for their coins against the current market price — helps quantify the depth of current losses. When a large portion of holders sits in loss territory, the pressure to sell typically decreases over time. Investors who planned to exit at a loss have often already done so.
Researchers note the current setup matches patterns seen near short-term market bottoms in previous cycles. Whether the drop deepens further or finds support at current levels depends on whether capital inflows return.
A Bitcoin whale dumped $172 million in BTC — And the broader data shows it was not alone
Bitcoin dropped to a local low of $66,529 and could not reclaim $70,000. At the time of writing, BTC traded at $66,975, down 3.11% on the day and 12.61% over the past week. The decline follows a prolonged stretch of selling pressure that began when Bitcoin failed to hold above $97,000 weeks earlier.
-1770818515593-1770818515594.png)
One transaction in particular captured attention. On-chain monitoring platform Lookonchain reported a whale depositing 2,500 BTC — valued at $172.56 million — into Binance. The wallet had started accumulating Bitcoin when prices hovered near $81,000 about two weeks prior, with the most recent purchase recorded just 13 hours before the deposit.

Once BTC slipped back below $70,000, the holder moved the position to an exchange and reduced exposure. The speed of the reversal — from buyer to seller within a two-week window — points to a holder who lost confidence in a near-term recovery.
-1770818639720-1770818639721.png)
Since the rejection at $97,000, whale sell-side pressure on price has ranged between 3% and 10%, indicating persistent and measurable negative pressure each time large holders offloaded. The pattern has not broken.
Sellers control the market as exchange inflows and technical readings align
The whale who deposited $172 million was not an isolated case. Data from Checkonchain showed that the combined category of whales and megawhales sold approximately 37,000 BTC in a single day, while their total exchange balance — which stood at 63,000 BTC a week earlier — registered a reduction.
According to CryptoQuant, Exchange Netflow rose to +1,300 BTC, with total inflows reaching 6,600 BTC at press time. A positive netflow means more holders moved coins onto exchanges — a consistent indicator of spot selling intent. Higher inflows have historically added downward pressure to prices in the short term, and the current readings follow that pattern.
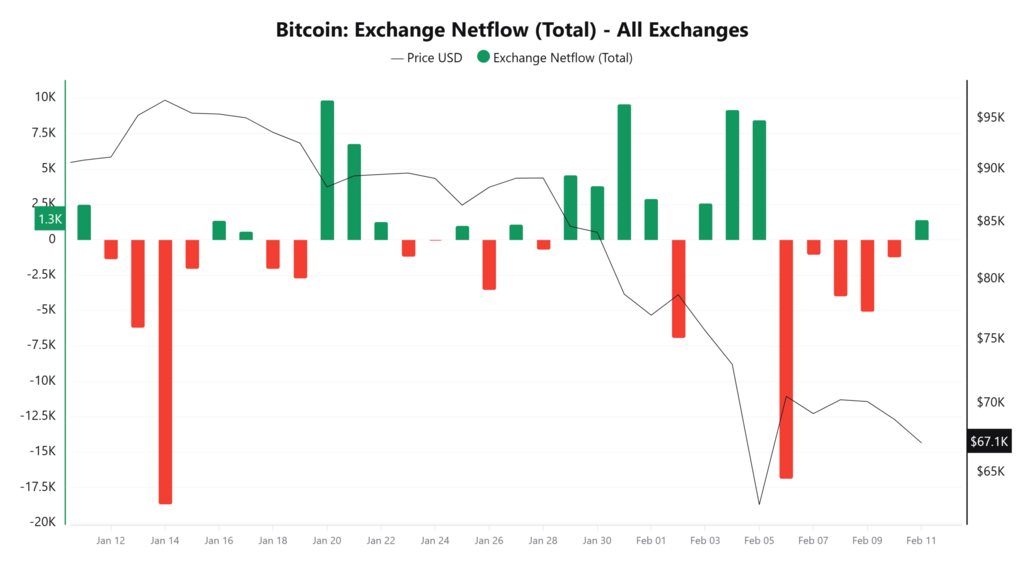
Buyer activity offers little counterweight. Seller strength climbed to 93, while buyer strength registered at −7. Buyers have not generated enough demand to absorb the ongoing supply coming from large holders and retail sellers alike. The imbalance leaves the market without a floor anchored by fresh purchasing.
Author

Isai Alexei
Independent Analyst
I am Isai Alexei. I work as a journalist and financial analyst covering cryptocurrency markets and traditional securities. I have spent ten years analyzing digital assets, trading activity, and market structure.