Bitcoin Price Prediction for today: $9200 as key value to regain composure
- Despite some turning pattern formation and a possible scenario favorable to the bulls, price confirmation is still needed for Bitcoin bulls
- Key support level to watch is at $7390 as the last barrier before February's lows at $6000

I remember well the night of March 9th 2009. The US stock indices had been falling non-stop for weeks and panic had taken over the markets. But that night we witnessed one of the biggest market interventions in history. S&P500 was around 650 and President Obama stepped up. During his live speech, committing to bring back calm to the markets, everything stopped. Nobody was trading, everyone in the markets listening to the POTUS. After he finished his speech, everything had changed. We started to see in our Times&Sales window multiple buy orders in the SPY (an ETF for S&P500), big orders for more than 500k units, around $350 milion per order. There were many and very well placed. Word out there had the Fed itself entering the market, "the hand of God". We already what happend afterwards.
The Fed doesn't intervene in the Crypto sphere, neither do it the big banks. There is no hand of God. We are not about to see gigantic buy orders to intimidate bears. This is a much more transparent market, free from manipulations, but also much more fragile.
I'm telling this story just to put some perspective on a possible bullish turn. If you are expecting such a move, some price action that ends the bearish run in Cryptos and propells the prices way up, it's probably not going to happen.
BTC/USD 4H chart
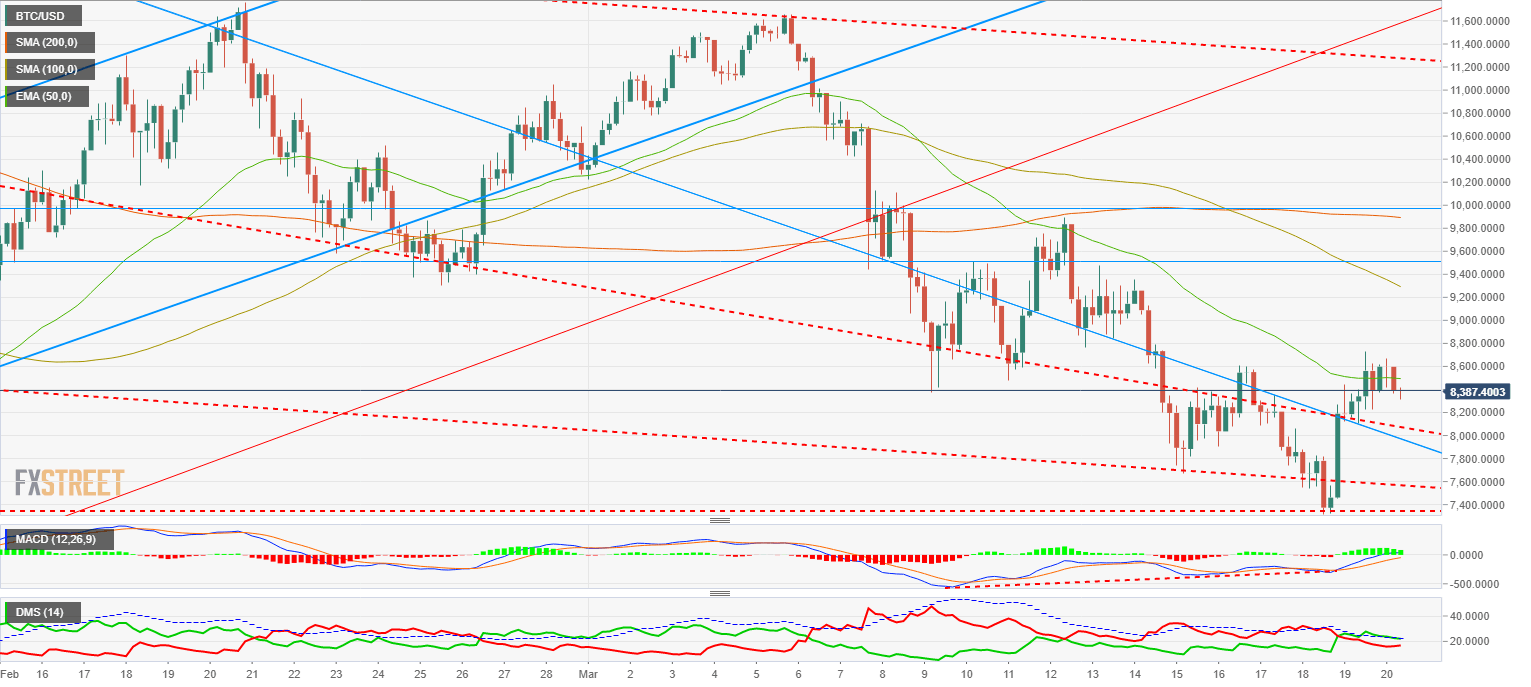
Bitcoin is trading around $8400 after trying and failing to break above the 50-EMA. Below there, support can be found around $8100 at first, followed by $7950, $7590 and $7390 at last. Doors to more aggressive selling would be open in lower levels, down to $6000.
As a bullish scenario, first resistance is located in the aforementioned 50-EMA, located now at $8494, followed above there by the 100-SMA at $9292. Price resistance is at $9515 and the last one, the most important one, is the 200-SMA at $9892.
MACD in the Bitcoin 4-hour chart is moving around the neutral line, showing a certain pause in the rebound from lows from last Sunday. BTC price will likely move around the current area for several periods.
Directional Movement Index is giving a certain edge to the buyers, but with a lose of steam from lows, that would confirm a possible pause in the movement. Sellers have increased slightly. ADX is showing very flat, but well above the 20 mark that indicates the strength in the trend.
Author

Tomas Salles
FXStreet
Tomàs Sallés was born in Barcelona in 1972, he is a certified technical analyst after having completing specialized courses in Spain and Switzerland. He expanded his technical training following the guidance of great experts on the financial markets.


