Bitcoin Price Prediction: BTC/USD volatility kick starts rally to $10,400 – Confluence Detector


  • Bitcoin embraces the return of volatility with a falling triangle breakout.
  • BTC/USD technical picture remains positive even as consolidation starts to take root.
  • Bitcoin buyers to face the strongest resistance at $9,417 in preparation for lift-off to $10,400.

After many weeks of relatively little no Bitcoin price action, the leading cryptocurrency finally embraced a breath of fresh bullish air on Tuesday. Bitcoin’s volatility had fallen to a two-year low as reported but just like, the CEO of Binance, Changpeng Zhao told Bloomberg on Monday, a breakout came into the picture.

Bitcoin scaled several resistance levels that had proved impenetrable over the last weeks including $9,300 and $9,400. Unfortunately, the rally was cut short before taking down the seller congestion at $9,500.

A retreat occurred with BTC diving back into the $9,300 range. At the time of writing, BTC/USD is teetering at $9,368. The prevailing trend is strongly bearish amid higher intraday volatility levels. In other words, the path of least resistance is downwards as Bitcoin seeks formidable support from which it will stage the next attack on $9,500; a move that is likely to pave the way for massive gains targeting $10,400.

Looking at the daily chart, Bitcoin already confirmed a triangle breakout. The only thing delaying a rally is the lack of enough volume. The immediate upside is capped by the 50-day SMA. Gains above $9,400 are anticipated in the course of the trading on Wednesday if not consolidation will take precedence as observed with the sidelong moving RSI and MACD.

BTC/USD daily chart

BTC/USD price chart

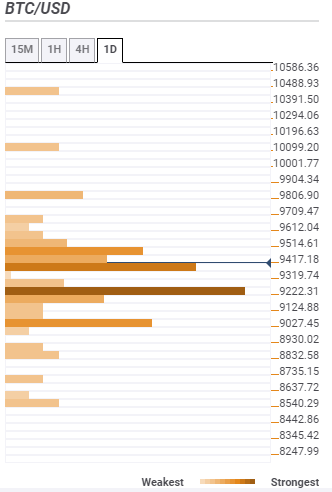
Bitcoin confluence resistance and support levels

Resistance one: $9,417 – This is the initial but strongest resistance zone. It hosts the Fibo 23.6% one-day, the SMA 50 15-minutes, the previous high 15-minutes and the SMA ten 1-hour indicators among others.

Resistance two: $9,514 – The second hurdle as highlighted by the pivot point one-week resistance two, the Bollinger Band 1-hour upper curve and the previous high one-day.

Resistance three: $9,806 – Stands out as the third key seller congestion zone that is home to the pivot point one-day.

Support one: $9,319 – This is the first support but it’s important to note that it is weak. It is highlighted by the Bollinger Band 1-hour lower curve.

Support two: $9,222 – The strongest support zone as shown by the SMA 50 14-hour, the SMA 200 1-hour, the Bollinger Band 4-hour and the pivot point one-day support one.

Support three: $9,027 – Highlighted by the SMA 100 daily, the Fibo 161.8% daily, the previous week low and the Bollinger Band lower curve.

fxsoriginal


Information on these pages contains forward-looking statements that involve risks and uncertainties. Markets and instruments profiled on this page are for informational purposes only and should not in any way come across as a recommendation to buy or sell in these assets. You should do your own thorough research before making any investment decisions. FXStreet does not in any way guarantee that this information is free from mistakes, errors, or material misstatements. It also does not guarantee that this information is of a timely nature. Investing in Open Markets involves a great deal of risk, including the loss of all or a portion of your investment, as well as emotional distress. All risks, losses and costs associated with investing, including total loss of principal, are your responsibility. The views and opinions expressed in this article are those of the authors and do not necessarily reflect the official policy or position of FXStreet nor its advertisers. The author will not be held responsible for information that is found at the end of links posted on this page.

If not otherwise explicitly mentioned in the body of the article, at the time of writing, the author has no position in any stock mentioned in this article and no business relationship with any company mentioned. The author has not received compensation for writing this article, other than from FXStreet.

FXStreet and the author do not provide personalized recommendations. The author makes no representations as to the accuracy, completeness, or suitability of this information. FXStreet and the author will not be liable for any errors, omissions or any losses, injuries or damages arising from this information and its display or use. Errors and omissions excepted.

The author and FXStreet are not registered investment advisors and nothing in this article is intended to be investment advice.

Join Telegram

Recommended content


Recommended Content

Editors’ Picks

Ethereum dips slightly amid Renzo depeg, BlackRock spot ETH ETF amendment

Ethereum dips slightly amid Renzo depeg, BlackRock spot ETH ETF amendment

Ethereum (ETH) suffered a brief decline on Wednesday afternoon despite increased accumulation from whales. This follows Ethereum restaking protocol Renzo restaked ETH (ezETH) crashing from its 1:1 peg with ETH and increased activities surrounding spot Ethereum ETFs.

More Ethereum News

Injective price weakness persists despite over 5.9 million INJ tokens burned

Injective price weakness persists despite over 5.9 million INJ tokens burned

Injective (INJ) price is trading with a bearish bias, stuck in the lower section of the market range. The bearish outlook abounds despite the network's deflationary efforts to pump the price. Coupled with broader market gloom, INJ token’s doomed days may not be over yet.

More Injective News

US intensifies battle against crypto privacy protocols following crackdown on Samourai Wallet

US intensifies battle against crypto privacy protocols following crackdown on Samourai Wallet

CEO Keonne Rodriguez and CTO William Lonergan of Samourai Wallet were arrested by the US Department of Justice (DoJ) on Wednesday and charged with $100 million in money laundering on a count and illegal money transmitting on another count. This move could see privacy-focused cryptocurrencies take a dip.

More Cryptocurrencies News

Near Protocol Price Prediction: NEAR fulfills targets but a 10% correction may be on the horizon

Near Protocol Price Prediction: NEAR fulfills targets but a 10% correction may be on the horizon

Near Protocol price has completed a 55% mean reversal from the bottom of the market range at $4.27. Amid growing bearish activity, NEAR could drop 10% to the $6.00 psychological level before a potential recovery. A break and close above $7.95 would invalidate the downleg thesis.

More Near Protocol News

Bitcoin: BTC post-halving rally could be partially priced in Premium

Bitcoin: BTC post-halving rally could be partially priced in

Bitcoin (BTC) price briefly slipped below the $60,000 level for the last three days, attracting buyers in this area as the fourth BTC halving is due in a few hours. Is the halving priced in for Bitcoin? Or will the pioneer crypto note more gains in the coming days? 

Read full analysis

BTC

ETH

XRP