|

Bitcoin price prediction: BTC/USD slips below $3,900   - Confluence Detector

  • BTC/USD are not ready to act.
  • A move back below $3,900 might trigger more selling pressure.

BTC/USD dropped like a stone, unable to settle above a critical $3,900 area. The price went as high as $3,947 on Sunday, but it seems that Bitcoin bulls are not ready yet for a decisive breakthrough. BTC/USD moved below SMA50 and SMA100 (1-hour) to trade at $3,877 at the time of writing, off the Asian low touched at $3,847.

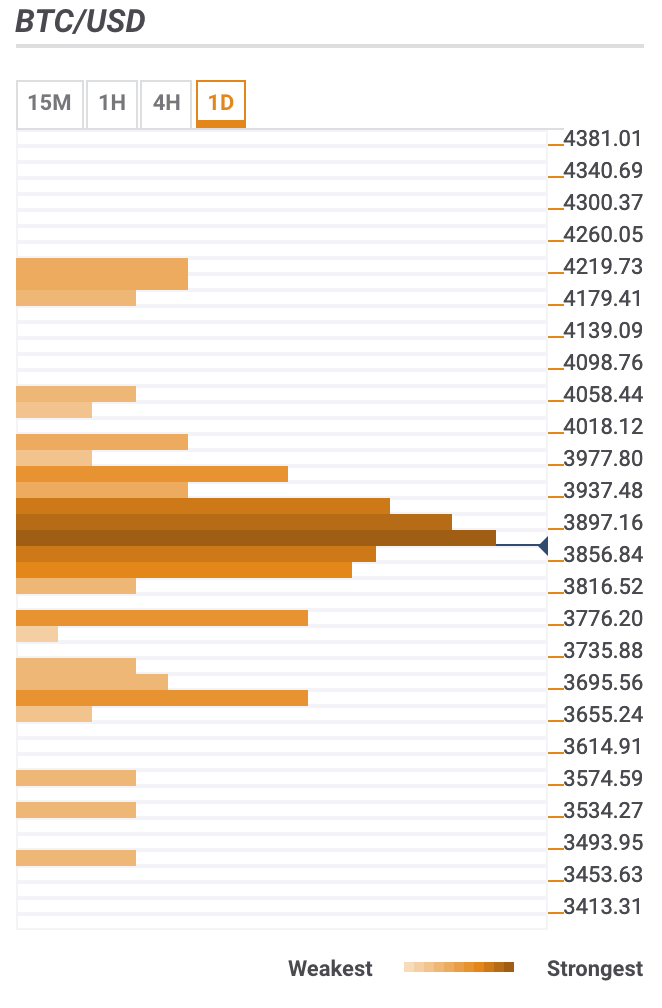
BTC/USD the daily confluence detector

We have a bunch of strong technical levels right above the current price and up until $3,950 handle. The resistance zone is going to be a hard nut to crack for Bitcoin bulls. The confluence of technical indicators include:

  • Lower boundaries of Bollinger Band on 1-hour and 15-min charts
  • A host of significant SMA levels like SMA100 and SMA50 (1-hour), SMA10 (4-hour)
  • Fibo retracement levels (38.2% monthly and daily, 23.6% daily, 61.8% daily)

A sustainable move above this area will clear up the way towards the next resistance zone $4,000 (Fibo 23.6% monthly and 61.8% Fibo retracement weekly) and $4,200 strengthened by the previous month high.

Below the current price, we can see a confluence of technical indicators, including SMA100 (4-hour), midline line of daily Bollinger Bands, a lower boundary of 4-hour Bollinger Band, 23.6% and 38.1% Fibo retracement weekly, SMA50 4-hour, SMA200 1-hour.

The next barrier is seen below $3,800 (Fibo retracement 61.8% weekly). It is followed by psychological $3,700 strengthened by 61.8% Fibo retracement monthly and the previous week’s low.

BTC/USD, 1D
Author

Tanya Abrosimova

Tanya Abrosimova

Independent Analyst

 

More from Tanya Abrosimova
Share:

Editor's Picks

Ripple and Stellar outlook: XRP rally cools, XLM heads toward a make-or-break support

Ripple and Stellar trade under pressure after losing over 2% and 3% so far this week. XRP and XLM are both nearing their crucial support zones, which could determine the next directional move. Meanwhile, mixed derivatives and on-chain data suggest upside potential remains limited for both altcoins. CryptoQuant’s summary data shows cautious signs for both altcoins.

Crypto Overview: Bitcoin dips below $78,000 – NEAR, ZEC sustain gains

Bitcoin trades below $78,000 maintaining a near-term corrective tone amid hawkish macroeconomic factors. US bond market shrugs off the US Treasury's increase in buyback operations to $6 billion in long-term debt as yields continue to rise, signaling an insufficient step amid the ongoing war with Iran.

Bitcoin outperforms global assets as $83K-$86K resistance zone continues to weigh on rally

Bitcoin has continued to recover from its mid-year weakness, outperforming major traditional assets over the past month, amid strong resistance around the $83,000 to $86,000 range. BTC gained 23% over the past 21 trading sessions, while the S&P 500 and Nasdaq 100 were broadly flat and the Euro Stoxx 50 declined, according to a Glassnode report published Wednesday.

Ethereum Price Forecast: ETH holds near $2,500 amid derivatives weakness
Ethereum (ETH) holds steady near $2,500 on Wednesday amid weakness in derivatives and mild buying dominance in spot markets. Since the short squeeze that expanded ETH's rally toward $2,500 in late August, meaningful leverage has yet to return to support the uptrend.
Bitcoin: Gearing up for a sharp move
Bitcoin (BTC) is trading around $81,000 on Friday, up over 4% so far this week, and awaits a key catalyst that could determine its next directional move. Strong institutional demand is supporting the bullish price action, with spot BTC Exchange Traded Funds (ETFs) on track to record a third straight week of inflows.



