Bitcoin Price Prediction: BTC/USD on the verge of free-fall to $8,000 – Confluence Detector
- Bitcoin poised for losses under $9,000 following a symmetrical triangle breakdown.
- BTC/USD is largely in the hands of the bears but consolidation could win the day as per the MACD.

Bitcoin, the largest cryptocurrency by market capitalization is trading marginally below $9,100. The weekend session was dominated by mainly selling pressure with the price reversing gains from levels above $9,300. The tentative support areas at $9,200 and $9,100 have already been overwhelmed. Attention in the bullish camp has now shifted from gaining traction towards $9,500 and eventually $10,000 to defending the critical level at $9,000.
Broken triangle support scenario
Bitcoin price recently broke critical triangle support. A breakdown followed with losses being experienced under $9,000. Although the price bounced back into the $9,000’s range, Bitcoin is not in the clear yet and the impact of the symmetrical triangle pattern still lingers. In this case, bulls must particularly ensure they hold the price above $9,000. This way, they will have an opportunity to gather the strength to take the fight to $9,500 and $10,000.
For now, the technical picture appears to be stable as highlighted by the MACD’s sideways action at the midline. However, I cannot fail to mention the slightly bearish divergence from the MACD. The divergence shows that selling pressure is present and bulls should pay attention to barricading $9,000. On the other hand, the RSI confirms the sideways trading with the sidelong movement at 45.
BTC/USD daily chart
-637290010315716749.png)
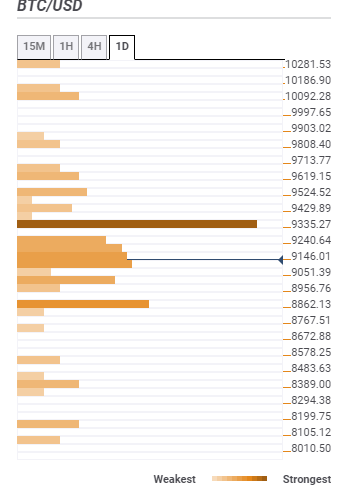
Bitcoin confluence resistance and support levels
Resistance one: $9,146 – as highlighted by the Bollinger band 1-hour middle, the previous high 15-minutes, previous low 1-hour, SMA ten 15-minutes and the Bollinger Band 4-hour.
Resistance two: $9,335 – This is the strongest resistance zone and is home to the Fibonacci 38.2% one-week, the Bollinger Band 4-hour upper, SMA 4-hour, SMA 200 1-hour and the pivot point one-day resistance two.
Support one: 9,051 – This is the initial support and home to the Bollinger Band 1-hour upper, the Fibo 61.8% daily, the previous week low and the pivot point one-day support one.
Support two: $8,862 – Is home to the pivot point one-day support two, pivot point one-week support one and the Fibo 61.8% one-month.
Author

John Isige
FXStreet
John Isige is a seasoned cryptocurrency journalist and markets analyst committed to delivering high-quality, actionable insights tailored to traders, investors, and crypto enthusiasts. He enjoys deep dives into emerging Web3 tren


