Bitcoin Price Prediction: BTC/USD $10,000 bull's eye – Confluence Detector
- Bitcoin price continues with this week’s winning streak towards $10,000.
- BTC/USD technical picture highlights possible consolidation above $9,500.

Bitcoin price kicked most of the tough resistance zones into the rearview on Wednesday. The return of volatility is finally directing attention back to Bitcoin after weeks of little to no price action.
The recovery that started on Tuesday this week saw Bitcoin initially take down the hurdle at $9,300. It briefly stepped above $9,400 but could not sustain gains to $9,500. After taking a breather, BTC/USD broke out again during the American session on Wednesday. This time, bulls were armed with enough momentum to penetrate the hurdles at $9,400 as well as $9,500.
The bullish leg extended towards $9,600 but the price retreated before the seller congestion at the area was overcome. In the meantime, Bitcoin is trading at $9,510 after advancing from the intraday low at $9,488. On the upside, an intraday high has been traded at $9,550 (short term resistance). The prevailing trend is, however, bullish which means that buyers are still relatively in control. On the flip side, the low volatility at the moment hints that price actions will be drab and limited in the near term.
The daily chart shows Bitcoin holding way above the 50-day SMA. This level gave bulls a hard time during recovery but will now function as support in the event BTC/USD reverses. Glancing forward, consolidation is likely to take over in the short term as seen with the MACD’s position slightly above the midline. It is essential to pay attention to the developing bearish grip as seen with the gradually retreating RSI.
Related reading: Ethereum Classic Market Update: ETC/USD unable to build momentum to $7.00
BTC/USD daily chart
 (3)-637310759248871937.png)
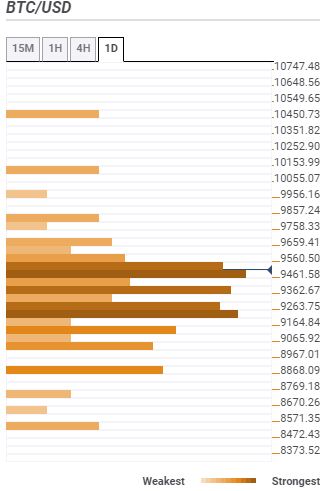
Bitcoin confluence resistance and support areas
Resistance one: $9,560 – This is the strongest resistance Bitcoin is dealing with at the moment. Highlighting it are the previous high 15-minutes, previous high 1-hour, the Fibonacci 161.8% one-week, the SMA five 1-hour and SMA ten 15-minutes.
Resistance two: $9,659 – Is home to the pivot point one-day resistance one and the pivot point one-week resistance three.
Resistance three: $9,857 – The seller congestion zone is brought to light by the Fibonacci 61.8% one-month.
Support one: $9,461 – The first of many support areas where a cluster of indicators converge. Some of them include the 38.2% Fibo one-month, the SMA 50 15-minutes, the SMA ten 1-hour and the Fibo 38.2% one-day.
Support two: $9,362 – Is home to the pivot point one-week resistance one, the previous week high, the SMA 50 1-hour, SMA 200 15-minutes and the pivot point one-day support one.
Support three: $9,263 – Hosts the Fibo 61.8% one-week, the Bollinger Band 1-hour lower, the SMA 100 4-hour and the SMA 200 4-hour among other indicators.
Author

John Isige
FXStreet
John Isige is a seasoned cryptocurrency journalist and markets analyst committed to delivering high-quality, actionable insights tailored to traders, investors, and crypto enthusiasts. He enjoys deep dives into emerging Web3 tren


