Bitcoin Price Prediction: Another BTC bulls massacre on the way - Confluence Detector
- Bitcoin may be on the verge of another massive sell-off.
- The critical resistance is created on approach to $11,300.

BTC/USD is changing hands at $10,980, getting ready to retest the psychological barrier of $11,000 for the first time since the sharp sell-off on September 3. As the price broke from the triangle pattern and extended the recovery above the local resistance of $10,700, many bullish BTC traders believe that the coin is on the verge of a massive upside move. However, the technical and on-chain data paints a different picture.
BTC/USD: On-chain metrics
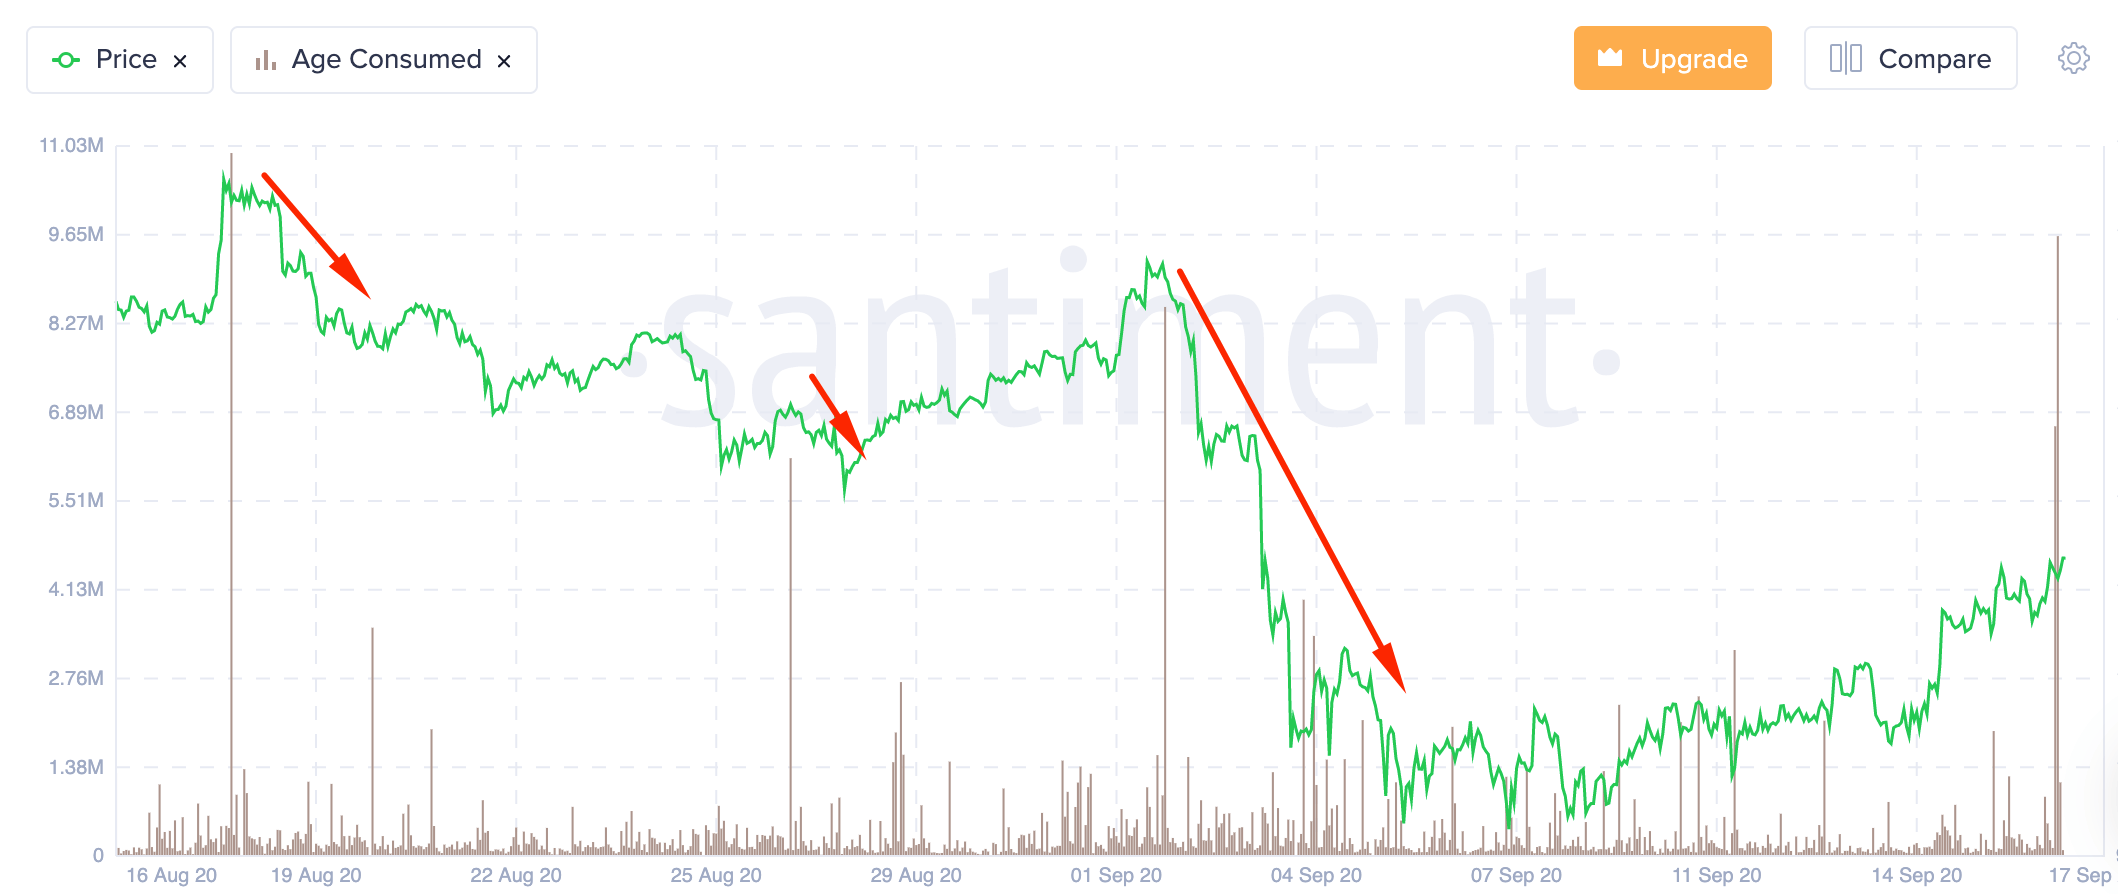
Bitcoin may be in for massive volatility according to the Age Consumed metric, provided by Santiment. This parameter shows how many tokes have changed their addresses on a specified date. Spikes in the graph usually appear before large price movements as they mean that a large number of tokens have come to motion after being idle for some time. As the chart below shows, three previous BTC prices went down on three earlier occasions of Age Consumed increase.
Bitcoin's Age consumed
Source: Santiment
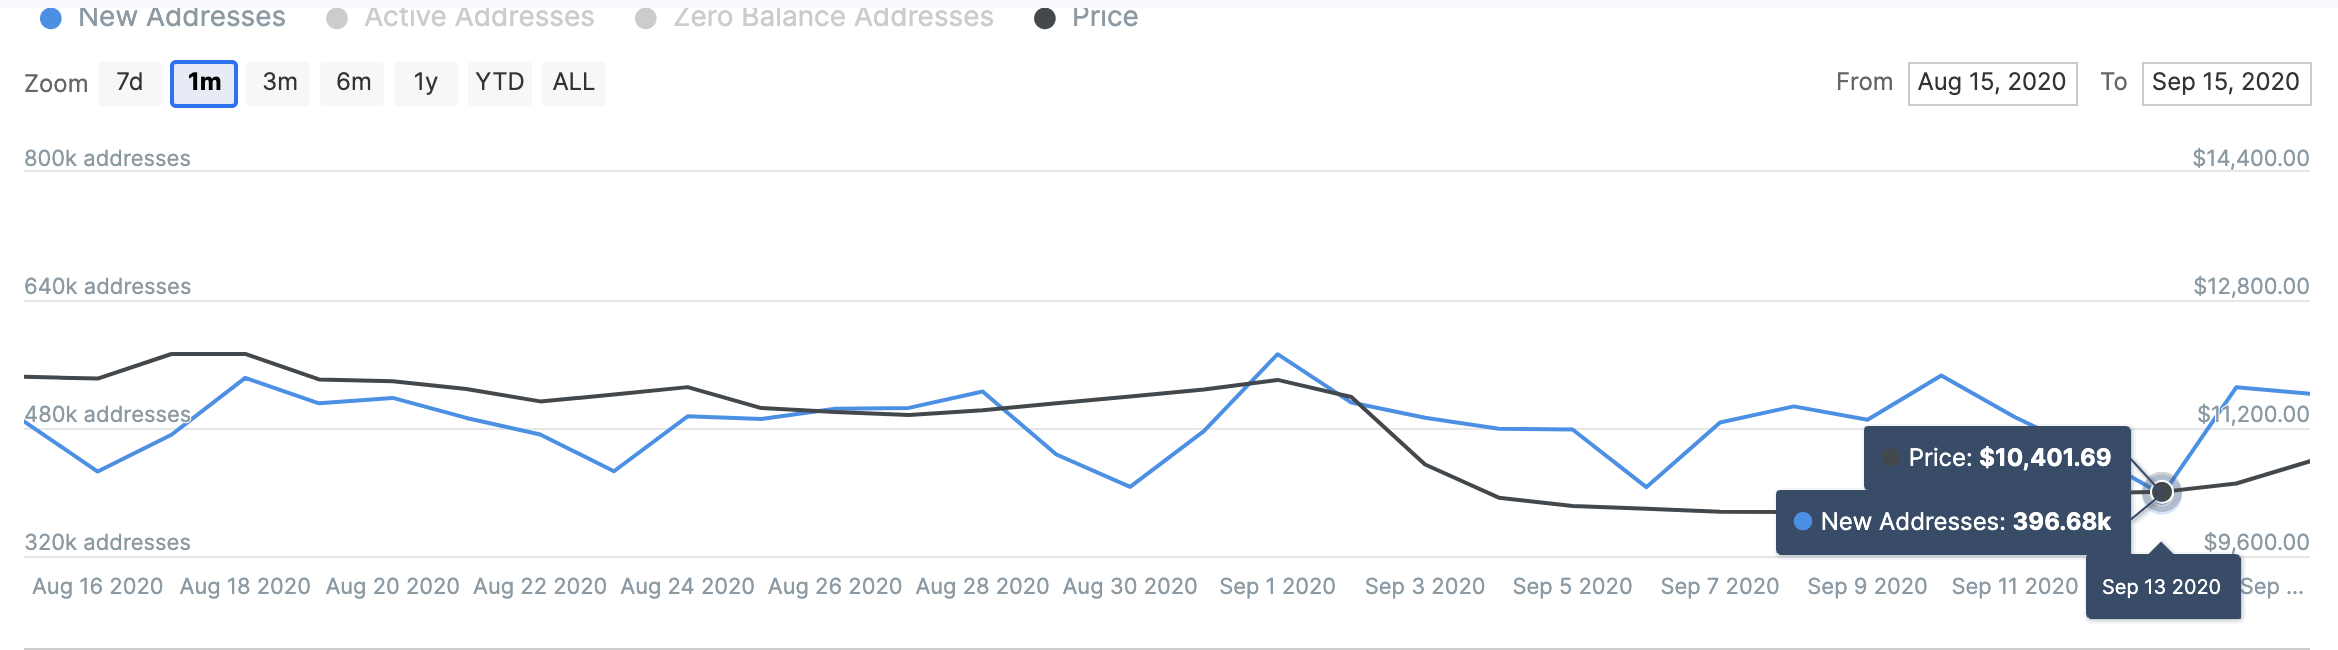
The data on new addresses supports the bearish setup as the metric has been decreasing recently, creating lower lows and lower highs. It means that the network has been shrinking lately, as the number of new buyers has decreased. It is also often used as a leading indicator with a negative correlation to price. The decreasing number of new addresses imply that fewer people are interested in joining the network and thus buying Bitcoins.
Bitcoin's new addresses
Source: Intotheblock
BTC/USD: The technical picture
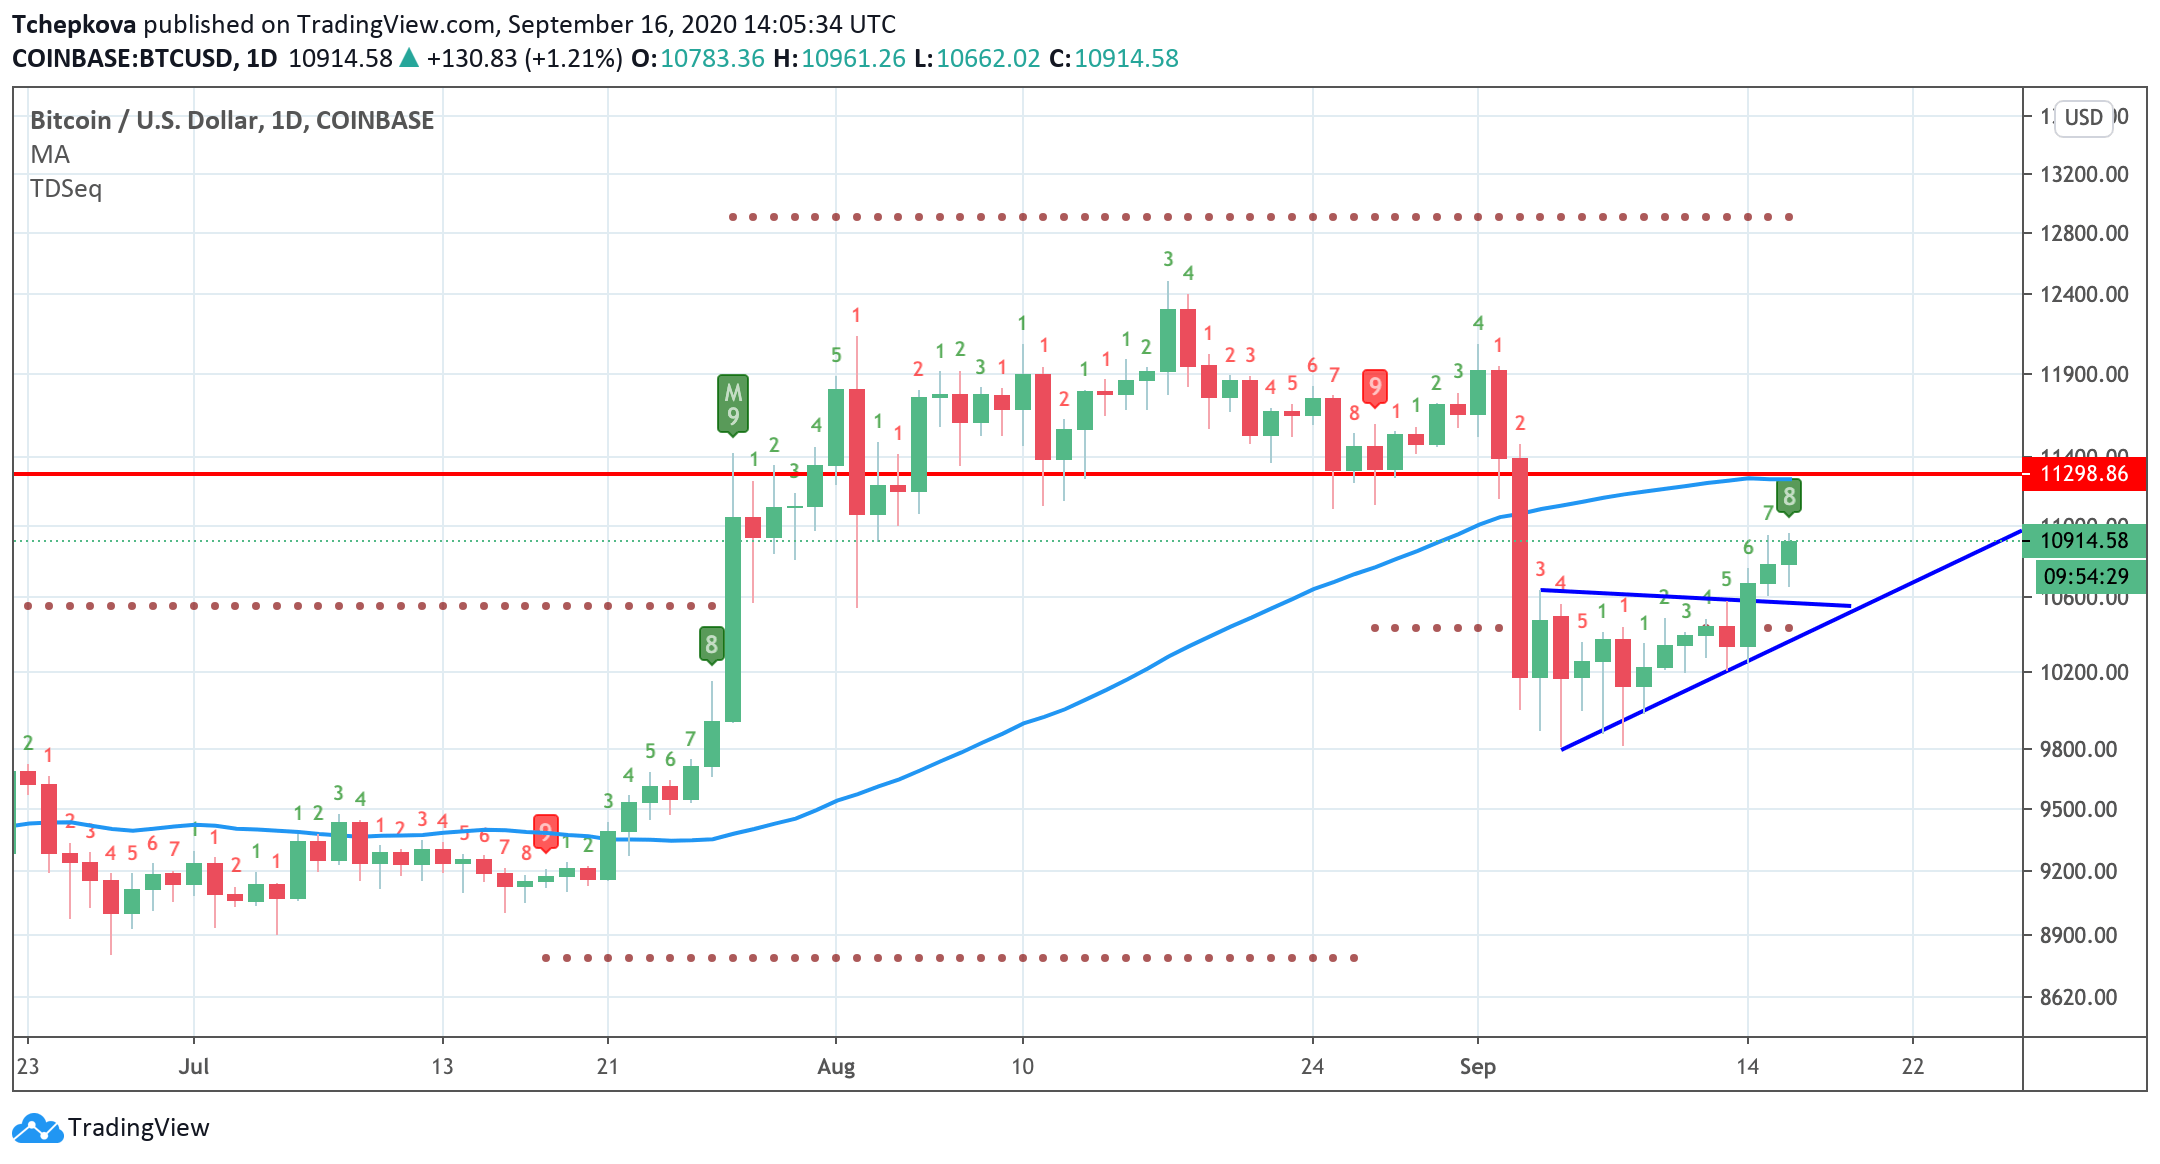
On the technical charts, the TD Sequential indicator is flashing eight, hinting at the growing bearish risks on the market. While the price may continue gaining ground in the nearest future, the bullish potential will fade away, approaching $11,200-$11,300. This area served as strong support for most of August, and also it is reinforced by the daily SMA50. The chances are that Bitcoin will retest it as resistance and reverse back to $10,500.
BTC/USD daily chart
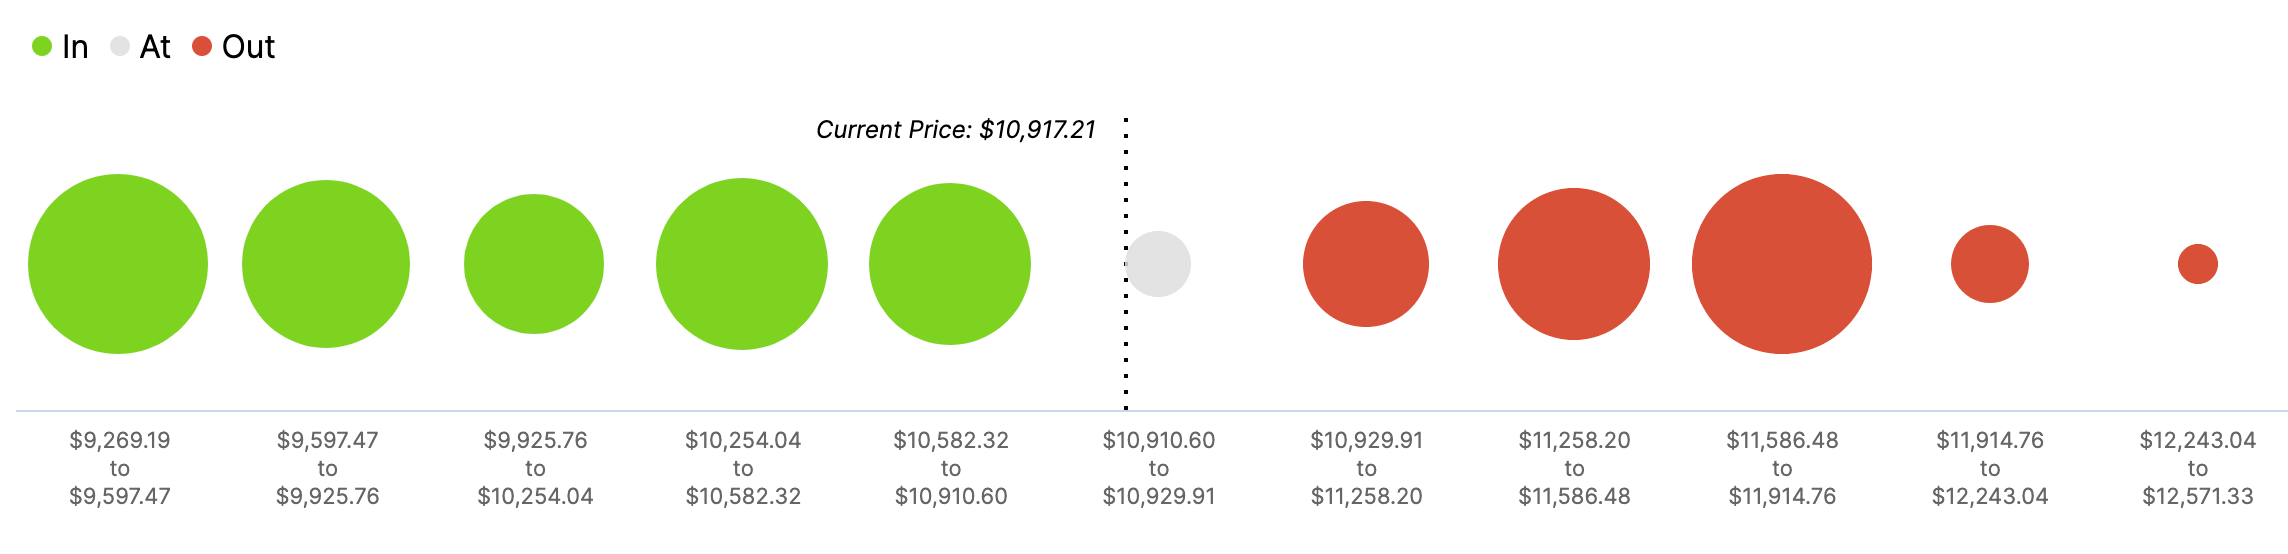
In and Out of the Money data provided by Intotheblock confirms that there is a barrier of nearly half a million BTC addresses with their breakeven point on the approach to $11,300. However, an even stronger supply wall comes at $11,700, with 1.2 million addresses holding nearly 1 million BTC. On the buy-side, the on-chain data confirms the significance of $10,500, with 1.35 million addresses ready to fight for this level.
Bitcoin's In and Out of the Money data
Source: Intotheblock
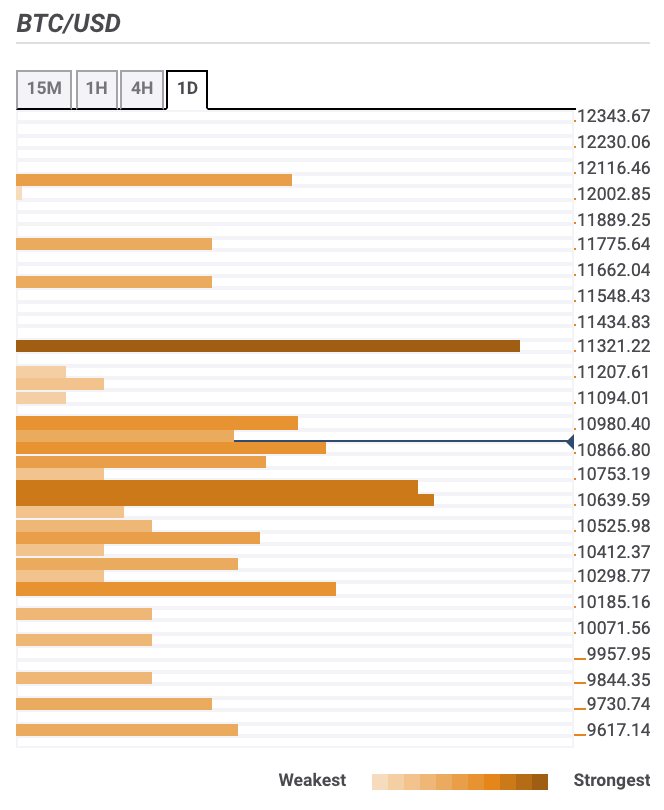
BTC/USD price confluence levels
The data on BTC price confluences shows the way to the South is cluttered with numerous support levels. Let's have a closer look at them.
Resistance levels
$11,000 - the higher line of the 1-hour Bollinger Band, Pivot Point 1-day Resistance 1
$11,300 - daily SMA50, 61.8% Fibo monthly, Pivot Point 1-day Resistance 3, Pivot Point 1-week Resistance 3
$12,000 - the upper line of the daily Bollinger Band, 23.6% Fibo monthly
Support levels
$10,700 - 4-hour SMA100, Pivot Point 1-week Resistance 1, the lower line of the 1-hour Bollinger Band
$10,500 - 1-hour SMA200, 4-hour SMA50, 161.8% Fibo projection daily
$10,200 - the lower line of the 4-hour Bollinger Band, 38.2% Fibo weekly
BTC/USD, 1-day
Author

Tanya Abrosimova
Independent Analyst



