|

Bitcoin Price Forecast: BTC/USD ready for further growth after a move above $9,300 – Confluence Detector

  • BTC/USD may continue growing towards the next resistance of $9,600.
  • The ultimate target of $10,000 is within reach now.


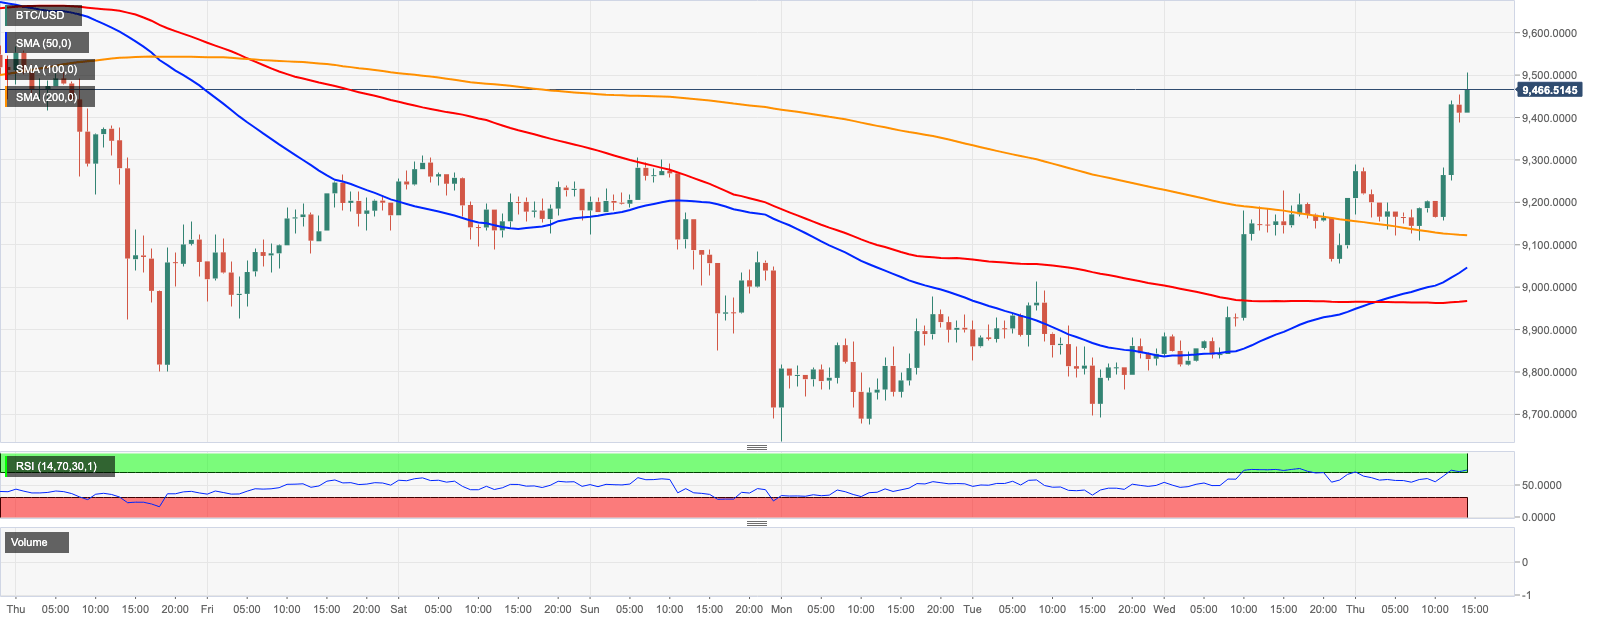
BTC/USD tested $9,500 during early US hours and settled at $9,450 by press time. The sustainable move above $9,300 improved the technical picture and opened up the way to the next resistance created by $9,500-$9,600 that separates the price from a straight move to $10,000. BTC/USD has gained over 2.5% in recent 24 hours, while its market share increased to 66.3%

The intraday chart shows that the RSI stays inside an overbought territory, though there are no signals of reversal as of yet. It means that the coin may repeat the attempt to break above $9,500-$9,600 in the nearest future.

BTC/USD 1-hour chart
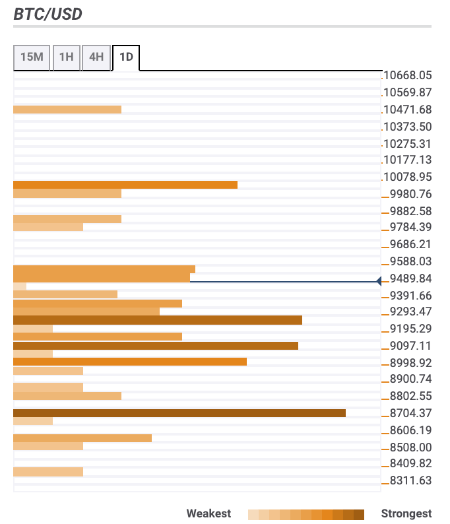
Let’s have a closer look at support and resistance levels clustered around the current price.

Resistance levels

$9,500 – 61.8% Fibo retracement weekly, Pivot Point 1-day Resistance 2
$10,000 – Pivot Point 1-month Resistance 1, the upper line of the daily Bollinger Band
$10,500 – Pivot Point 1-week Resistance 2

Support levels

$9,300 – 38.2% Fibo retracement weekly, the middle line of the daily Bollinger Band, the highest level of the previous day
$9,000 - 38.2% Fibo retracement daily, 23.6% Fibo retracement weekly, 4-hour SMA10
$8,700 - 23.6% Fibo retracement monthly, Pivot Point 1-day Support 2
 

fxsoriginal

Author

Tanya Abrosimova

Tanya Abrosimova

Independent Analyst

 

More from Tanya Abrosimova
Share:

Editor's Picks

Starknet Price Forecast: STRK rally tests key breakout amid proposed Layer-1 transition

Starknet is up 16% so far on Friday, advancing its steady recovery of nearly 200% since mid-August. The rally aligns with the rising demand for financial anonymity in the cryptocurrency market and the CEO of StarkWare, Eli Ben-Sasson’s proposed transition of Starknet to Layer-1 to achieve quantum security by 2027.

Top 3 Price Prediction: BTC sheds 5%, ETH loses 50-day EMA, XRP risk breakdown

Bitcoin, Ethereum, and Ripple remain under pressure on Friday after losing over 5%, 9% and 8% so far this week. BTC trades below $82,000, ETH loses $2,500, while XRP retreats toward a key support zone. The price action of these top three cryptocurrencies now faces critical technical levels that could determine whether the correction deepens or a recovery takes shape.

Ethereum Price Forecast: ETH drops below $2,500 as rising Treasury yields trigger selling pressure​

Ethereum fell below $2,500 on Thursday, down nearly 4% and extending losses for a third consecutive day. The decline follows rising Oil prices and US Treasury yields over the past few days. The 10Y Note Yield reached a 24-year high at 5.35%, and the 30Y Note Yield climbed above 5.70% earlier in the day, sparking major distributions in the crypto market.

Hyperliquid Price Forecast: HYPE drops to $84 as Hyperliquid Labs begins $330 million OTC distribution
Hyperliquid Labs distributed 3.75 million HYPE tokens, worth about $330 million, through an over-the-counter (OTC) arrangement with an undisclosed institution, rather than selling the tokens on public exchanges. According to onchain data shared by OnchainLens on Wednesday, the tokens completed a seven-day unstaking period before the full allocation was credited to Hyperliquid Labs’ spot balance.
Bitcoin: Is BTC setting up for an Uptober rally?
Bitcoin (BTC) extends its gains, trading near $86,000 at the time of writing on Friday after closing September 6.33% up, reversing its seasonal weakness. Historical data suggest October could be a strong month for BTC, especially after a positive September.



