Bitcoin Price Forecast: BTC falls below $106,000 as risk-off sentiment persists
- Bitcoin price faces rejection around its $106,406 resistance level on Tuesday, hinting at a potential correction ahead.
- Market sentiment sours as growing Israel-Gaza tensions weigh on riskier assets, such as BTC.
- Bitcoin spot ETFs recorded an outflow of $267.52 million on Monday, extending a losing streak for the third consecutive day.

Bitcoin (BTC) is facing rejection around a key resistance level and trades below $106,000 at the time of writing on Tuesday. The technical outlook supports a correction as risk-off sentiment persists due to the rising tensions between Israel and Gaza. The weakness in bullish momentum is further evident as Bitcoin spot Exchange Traded Funds (ETFs) have recorded a losing streak for the third consecutive day.
Risk-on sentiment fade as global geopolitical conflict escalates
The New York Times reports on Tuesday that the Israeli military began shooting after people strayed from a designated route toward a food distribution site in southern Gaza. The Gaza health ministry said that the troops killed at least 27 people and wounded dozens.
"Israeli soldiers also opened fire on Sunday near an approach to the same food distribution site, in an incident that Palestinian officials said killed at least 23 people and it followed several episodes of unrest last week," says the report.
Apart from growing Israel-Gaza tensions, the Russia-Ukraine war is also escalating, as reported in a previous report.
These rising war tensions and geopolitical uncertainties are driving investors toward safe-haven assets, such as Gold (XAU), which brings a risk-off sentiment to the market, not boding well for the Bitcoin price.
Institutional demand shows early signs of weakness
Institutional demand for Bitcoin continued to weaken at the start of the week. According to SoSoValue data, Bitcoin spot ETFs experienced an outflow of $267.52 million on Monday, continuing a three-day streak of outflows since last Thursday. This outflow is weak as compared to the flow seen during February. However, if this outflow intensifies, then the Bitcoin price could see a sharp decline in the upcoming days.
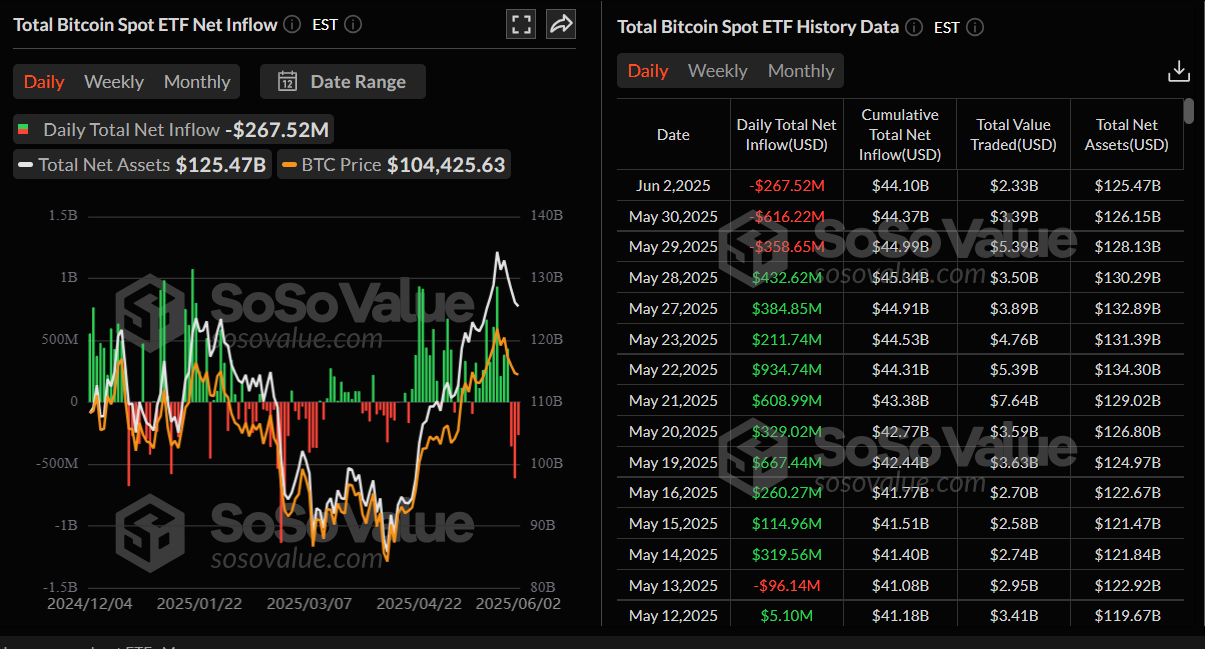
Total Bitcoin Spot ETFs daily chart. Source: SoSoValue
Bitfinex's report on Tuesday highlights that the current pullback in BTC reflects a change in tempo, following nearly 50 days of uninterrupted upside marked by minimal retracements, which reached its new all-time high of $111,980.
The report further explains that this retracement is not just technical — it comes amid renewed macroeconomic pressure following the unexpected reinstatement of tariffs by the US government, resulting in a breakout in 30-year Treasury yields above 5% and a wave of risk-off sentiment.
Some signs of optimism
Bitcoin price recovered slightly on Monday and closed above $105,800. This recovery was fueled by news that came in the late American session, stating that US President Donald Trump's administration is asking countries to submit their best trade offers by Wednesday.
Additionally, a White House spokesperson said that President Trump and Chinese President Xi Jinping were planning to meet later this week. These headlines helped improve the risk mood toward the end of the day, supporting a recovery in riskier assets, such as Bitcoin. If the tariff uncertainty eases this week, it could support further price recovery in risky assets.
Bitcoin Price Forecast: BTC faces resistance around $106,400
Bitcoin price closed below its daily level of $106,406 on Thursday and declined by 1.5% the following day. However, BTC recovered slightly over the weekend and also on Monday. At the time of writing on Tuesday, it faces rejection around the daily level of $106,406.
If BTC continues to correct, it could extend the decline to retest its next key support level at $100,000, a psychological level.
The RSI on the daily chart reads 52 and points downward toward its neutral level of 50, indicating fading bullish momentum. If the RSI falls below its neutral level of 50, it would suggest increasing bearish momentum and a decline in Bitcoin's price. Moreover, the Moving Average Convergence Divergence (MACD) showed a bearish crossover. It also shows a rising red histogram bar below its neutral level, suggesting the continuation of the downward trend.
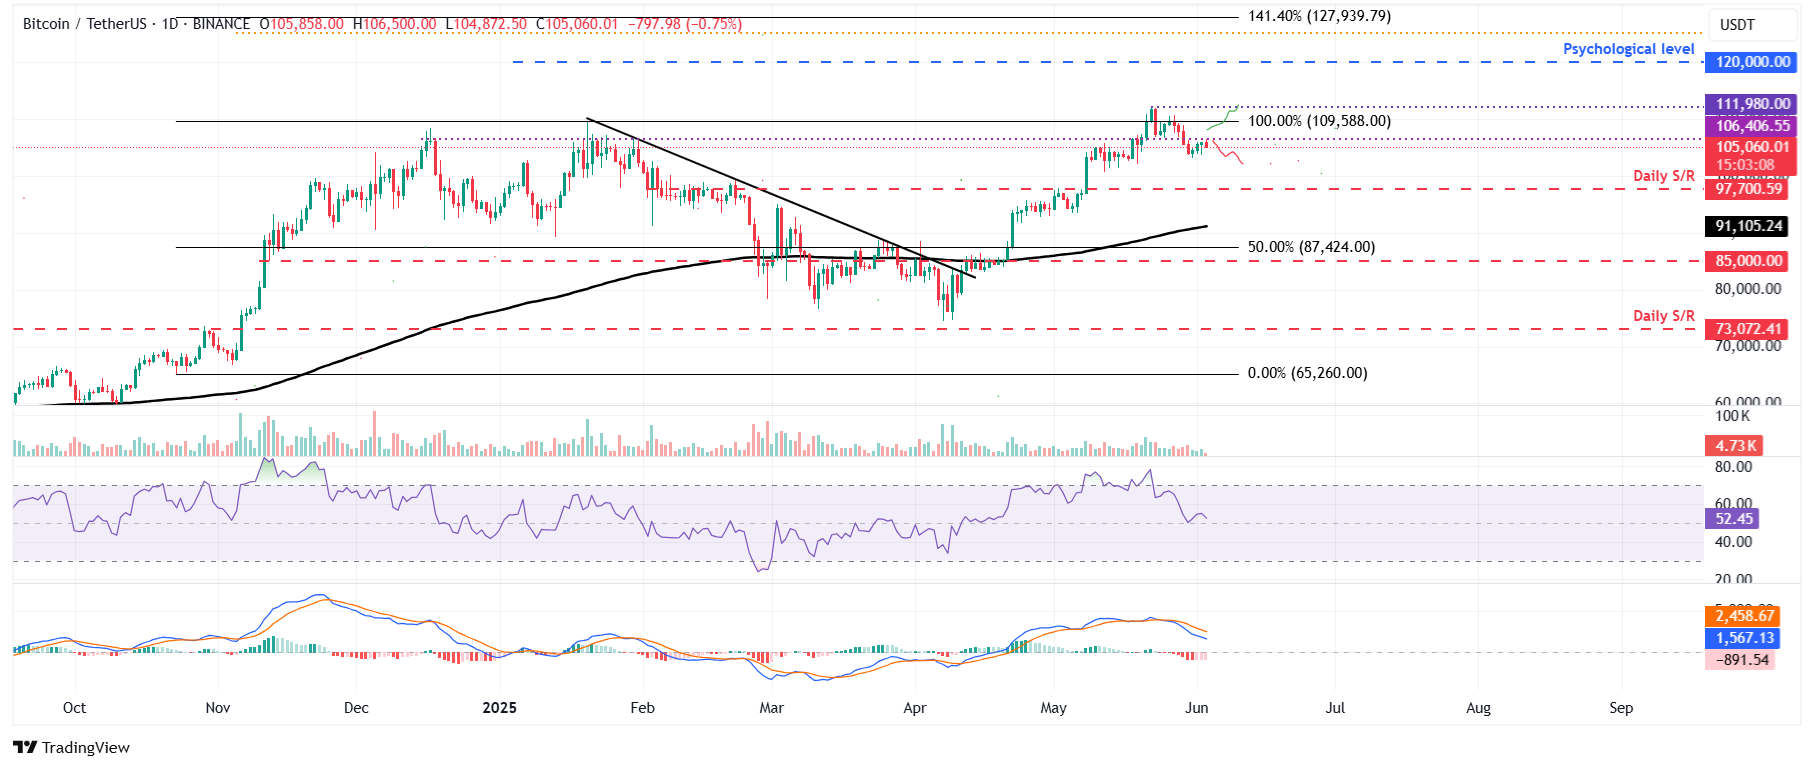
BTC/USDT daily chart
However, if BTC recovers and closes above $106,406, it could extend the rally toward its all-time high of $111,980.
Bitcoin, altcoins, stablecoins FAQs
Bitcoin is the largest cryptocurrency by market capitalization, a virtual currency designed to serve as money. This form of payment cannot be controlled by any one person, group, or entity, which eliminates the need for third-party participation during financial transactions.
Altcoins are any cryptocurrency apart from Bitcoin, but some also regard Ethereum as a non-altcoin because it is from these two cryptocurrencies that forking happens. If this is true, then Litecoin is the first altcoin, forked from the Bitcoin protocol and, therefore, an “improved” version of it.
Stablecoins are cryptocurrencies designed to have a stable price, with their value backed by a reserve of the asset it represents. To achieve this, the value of any one stablecoin is pegged to a commodity or financial instrument, such as the US Dollar (USD), with its supply regulated by an algorithm or demand. The main goal of stablecoins is to provide an on/off-ramp for investors willing to trade and invest in cryptocurrencies. Stablecoins also allow investors to store value since cryptocurrencies, in general, are subject to volatility.
Bitcoin dominance is the ratio of Bitcoin's market capitalization to the total market capitalization of all cryptocurrencies combined. It provides a clear picture of Bitcoin’s interest among investors. A high BTC dominance typically happens before and during a bull run, in which investors resort to investing in relatively stable and high market capitalization cryptocurrency like Bitcoin. A drop in BTC dominance usually means that investors are moving their capital and/or profits to altcoins in a quest for higher returns, which usually triggers an explosion of altcoin rallies.
Author

Manish Chhetri
FXStreet
Manish Chhetri is a crypto specialist with over four years of experience in the cryptocurrency industry.


