Bitcoin price capitulates while whales buy BTC at a discount
- Bitcoin price rebounds, retaking the strategically important 200-day simple moving average (SMA).
- BTC is now challenging former support around the 38.2% Fibonacci retracement of the rally beginning March 2020.
- Bullish hammer candlestick on 4-hour chart provided tactical trading opportunity.

Bitcoin price has rallied over 40% from yesterday’s intra-day low to the price at time of writing ($41,728) but remains almost 35% below the all-time high of $64,899 printed on April 14. The substantial rebound has alleviated some of the pain of the past two weeks, but it has not clarified the outlook for the bellwether cryptocurrency moving forward.
5th largest correction puts everything into perspective
Bitcoin price crashed 53.7% from the all-time to yesterday’s low, making it the 5th largest decline for BTC in its relatively short history, according to Coin98 Analytics. Such violent moves in a condensed period are consistent with panic selling built on forced liquidations driven by cascading margin calls.
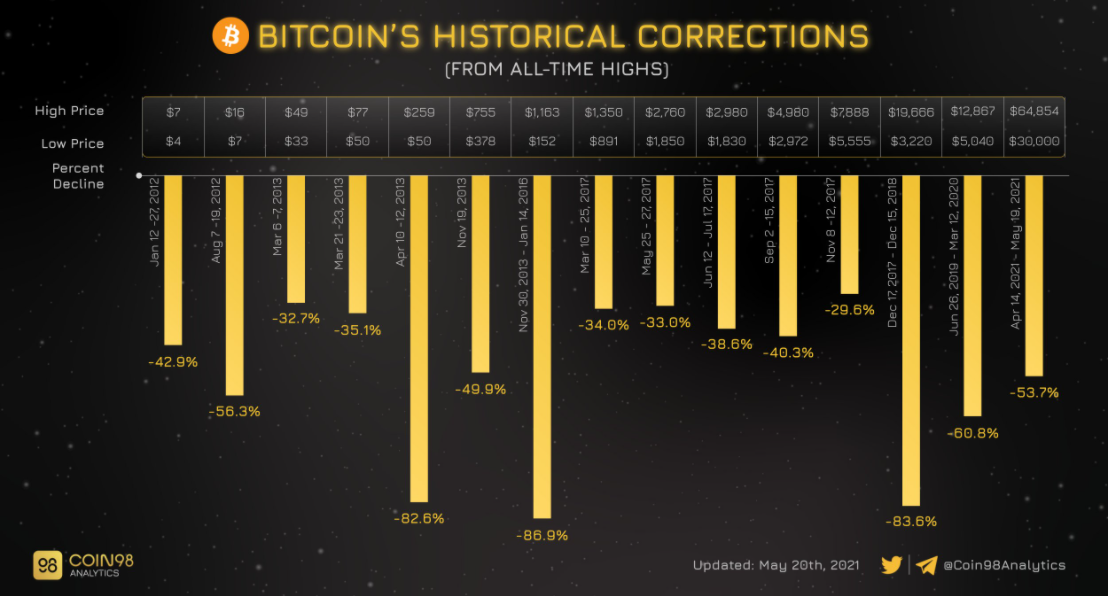
BTC historical corrections via Coin98 Analytics
The magnitude of the selling pressure left the largest cryptocurrency trading platforms struggling to manage disruptions—for example, Binance, the largest cryptocurrency exchange, temporarily disabled Ethereum withdrawals due to a network bottleneck. Coinbase Global was struck with periods of downtime.
The chaos on the major platforms left investors infuriated. Some tried to buy the decline while others tried to either adjust their stops to accommodate the selling or liquidate holdings. Instead, they were forced to be spectators.
BTC open interest on Bitmex experienced the most significant drop in 2021 and the largest since 2020. It highlights the size of positions being closed, largely due to forced liquidations.
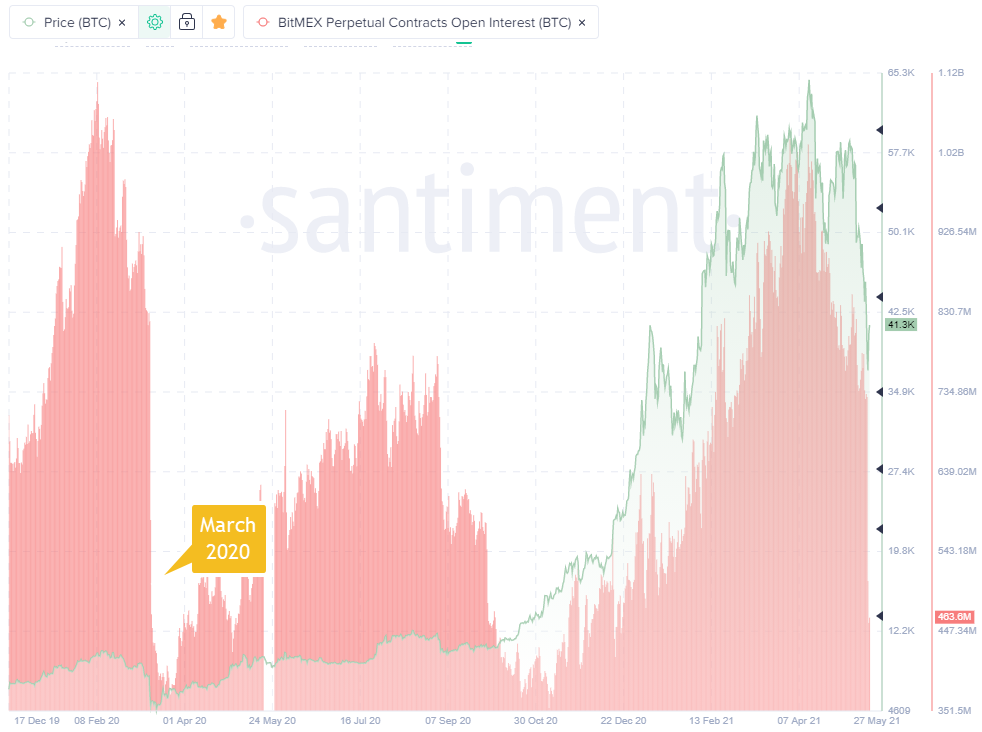
BitMex BTC open interest - Santiment
The market value to realized value (30day) shows the average profit or loss of those holding BTC tokens that moved in the last 30 days, based on the price when each token last moved.
During this crash, the metric fell into an extreme undervalued zone. The decline did offer an excellent risk-reward opportunity, at least for the tactical investor. Time will tell if it was beneficial for the longer-term orientated investor.
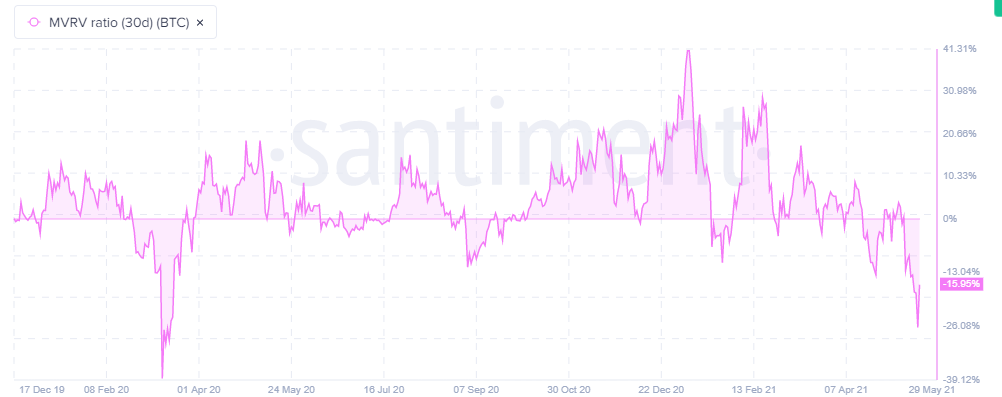
BTC MVRV 90day metric - Santiment
According to Philip Gradwell, a bullish development during the decline was that investor whales were buying the dip, accumulating 34k BTC on Tuesday and Wednesday after cutting their positions by as much as 51k bitcoin in the last two weeks.
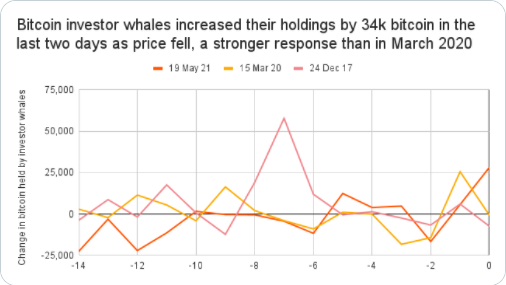
Change in BTC held by investor whales
As with all major market events, investors and experts question whether it is the end for the specified asset class or a new beginning. Bitcoin price will dictate whether it was another violent correction in a long process of adoption and acceptance as a long-term investment opportunity and, ultimately, a relevant and credible store of value.
Bitcoin price enters a period of uncertainty
Yesterday, Bitcoin price closed with a bullish hammer candlestick on the four-hour chart. A buy signal was triggered on the following candlestick when BTC traded above the hammer high before stalling at formidable resistance.
The critical resistance level is framed by the 38.2% Fibonacci retracement of the rally from March 2020 at $41,581, the January high at $41,986 and the February low at $43,016. Adding to the importance of the price range now is the 38.2% retracement level of the decline from the all-time high at $64,899 to yesterday’s low at $43,331.
Investors should prepare for a period of oscillations as support and resistance levels are tested and retested. Bitcoin price is anticipated to correct at least a portion of yesterday’s rebound with credible support at $34,777. A decline below that level will inspire more selling, taking Bitcoin price down to the 78.6% retracement of yesterday’s rebound at $32,677.
Until Bitcoin price is above $43,400 on a daily closing basis, a test of $30,000 cannot be ruled out.
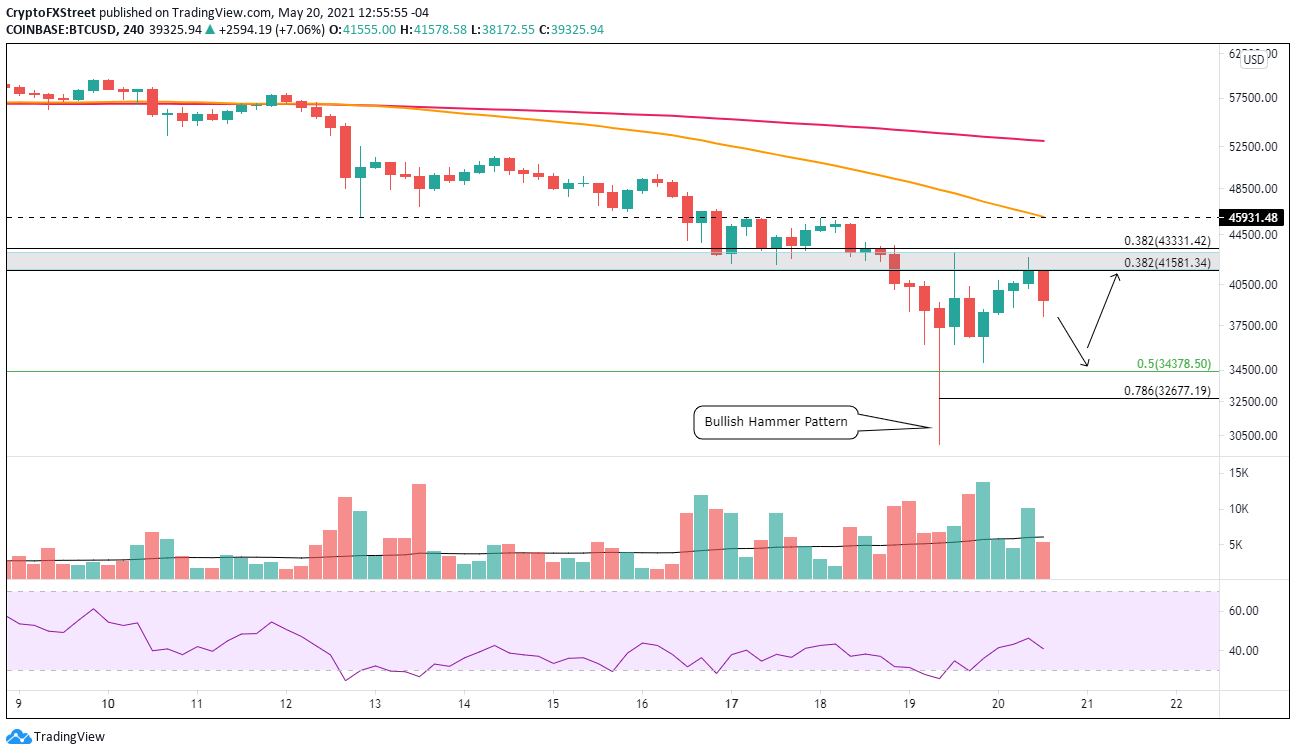
BTC/USD 4-hour chart
A daily close above $43,400 will confirm a new trend for BTC, but it will be challenged quickly by the 50 four-hour SMA at $46,000. After clearing $46,000, Bitcoin price will be released to the 50-day SMA at $54,873.
Author

Sheldon McIntyre, CMT
Independent Analyst
Sheldon has 24 years of investment experience holding various positions in companies based in the United States and Chile. His core competencies include BRIC and G-10 equity markets, swing and position trading and technical analysis.


