Bitcoin Price Analysis: Sellers on revenge mission as BTC/USD touches $9,250 – Confluence Detector


  • Bitcoin recovery from the recent dip to $9,250 stalls under $9,500.
  • BTC/USD is relatively in the hands of the bulls who lack enough momentum to sustain gains above $9,500.

Bitcoin buyers have been reduced to defenders after another rejection from $10,000. Initially, they defended the support between $9,500 and $9,600 but the strong arm of the bears caught up with them, resulting in losses towards $9,000. The region at $9,250 is now being defended as the key support area. On the upside, recovery has been capped under $9,500. There was a break above $9,500 but buyers lost steam at $9,567 during the Asian session.

At the time of writing, Bitcoin is trading at $9,466, which is a 0.46% loss from the opening value at $9,512. BTC/USD bulls are not giving up the fight to $10,000 in spite of the stronger bearish grip. The main goal is to sustain gains above $9,500 and step above the resistance at $9,600. This way, other buyers watching from the sidelines can join the market and aid in pushing the price to $10,000.

From a technical perspective, it is true to say that bulls are relatively in control. Although, we cannot forget the fact that they lack the momentum to sustain the gains. For example, the RSI is horizontal at 60 to show that there is enough energy to hold Bitcoin above $9,520 if not $9,400. Moreover, the MACD is comfortable seating in the positive region, further emphasizing the influence bulls have on the price.

BTC/USD daily chart

BTC/USD price chart

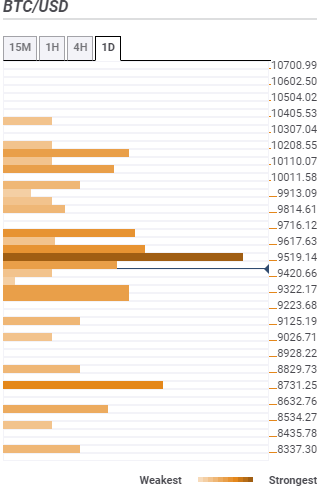
Bitcoin confluence resistance and support areas

Resistance one: $9,519 – Is the region that hosts the previous high one-hour, SMA 200 1-hour, and the Bollinger Band 1-hour middle.

Resistance two: $9,617 – Highlighted by the SMA 100 15-minutes and the SMA five one-day.

Resistance three: $9,716 – Where the Fibonacci 61.8% one-day, SMA 200 15-minutes, and the Bollinger Band 4-hour middle curve meet.

Support one: $9,420 – A weak support area highlighted by only the SMA ten one-day.

Support two: $9,322 – A medium-strong support area home to the Bollinger band one-day Middle, the previous low one-day, and SMA 100 4-hour.

Support three: $8,731- A support areas hosting the Fibonacci 23.6% one-month and the pivot point daily support three.

fxsoriginal

Bitcoin intraday levels

BTC/USD

Overview
Today last price 9442.69
Today Daily Change -69.43
Today Daily Change % -0.73
Today daily open 9512.12
 
Trends
Daily SMA20 9288.47
Daily SMA50 8049.22
Daily SMA100 7988.15
Daily SMA200 8056.43
 
Levels
Previous Daily High 9839.44
Previous Daily Low 9296.03
Previous Weekly High 9944.79
Previous Weekly Low 8105.58
Previous Monthly High 9476.83
Previous Monthly Low 6156.67
Daily Fibonacci 38.2% 9503.61
Daily Fibonacci 61.8% 9631.86
Daily Pivot Point S1 9258.95
Daily Pivot Point S2 9005.78
Daily Pivot Point S3 8715.54
Daily Pivot Point R1 9802.36
Daily Pivot Point R2 10092.61
Daily Pivot Point R3 10345.77


Information on these pages contains forward-looking statements that involve risks and uncertainties. Markets and instruments profiled on this page are for informational purposes only and should not in any way come across as a recommendation to buy or sell in these assets. You should do your own thorough research before making any investment decisions. FXStreet does not in any way guarantee that this information is free from mistakes, errors, or material misstatements. It also does not guarantee that this information is of a timely nature. Investing in Open Markets involves a great deal of risk, including the loss of all or a portion of your investment, as well as emotional distress. All risks, losses and costs associated with investing, including total loss of principal, are your responsibility. The views and opinions expressed in this article are those of the authors and do not necessarily reflect the official policy or position of FXStreet nor its advertisers. The author will not be held responsible for information that is found at the end of links posted on this page.

If not otherwise explicitly mentioned in the body of the article, at the time of writing, the author has no position in any stock mentioned in this article and no business relationship with any company mentioned. The author has not received compensation for writing this article, other than from FXStreet.

FXStreet and the author do not provide personalized recommendations. The author makes no representations as to the accuracy, completeness, or suitability of this information. FXStreet and the author will not be liable for any errors, omissions or any losses, injuries or damages arising from this information and its display or use. Errors and omissions excepted.

The author and FXStreet are not registered investment advisors and nothing in this article is intended to be investment advice.

Join Telegram

Recommended content


Recommended Content

Editors’ Picks

Ripple wipes out weekly gains, experts comment on role of Ripple stablecoin

Ripple wipes out weekly gains, experts comment on role of Ripple stablecoin

Ripple declined to $0.52 on Thursday, erasing all gains registered earlier this week. Ripple SVP Eric van Miltenburg’s comments on the firm’s stablecoin, and how it is expected to benefit the XRP Ledger and native token XRP have raised concerns among crypto experts. 

More Ripple News

Hedera HBAR slips nearly 10% after air is cleared on mistaken link with giant BlackRock

Hedera HBAR slips nearly 10% after air is cleared on mistaken link with giant BlackRock

HBAR price is down nearly 10% on Thursday, partly erasing gains inspired by the misinterpreted link with BlackRock. Despite the recent correction, Hedera’s price is up 44% in the past seven days.

More Hedera News

The reason behind Bonk’s 105% rise and if you should buy now Premium

The reason behind Bonk’s 105% rise and if you should buy now

Bonk price has shot up 105% in the past five weeks. A retracement into $0.0000216 or the $0.0000152 to $0.0000186 imbalance would be a good buying opportunity. Patient investors can expect double-digit gains from BONK that could extend up to 70%.

More Cryptocurrencies News

Injective price weakness persists despite over 5.9 million INJ tokens burned

Injective price weakness persists despite over 5.9 million INJ tokens burned

Injective price is trading with a bearish bias, stuck in the lower section of the market range. The bearish outlook abounds despite the network's deflationary efforts to pump the price. Coupled with broader market gloom, INJ token’s doomed days may not be over yet.

More Injective News

Bitcoin: BTC post-halving rally could be partially priced in Premium

Bitcoin: BTC post-halving rally could be partially priced in

Bitcoin (BTC) price briefly slipped below the $60,000 level for the last three days, attracting buyers in this area as the fourth BTC halving is due in a few hours. Is the halving priced in for Bitcoin? Or will the pioneer crypto note more gains in the coming days? 

Read full analysis

BTC

ETH

XRP