Bitcoin Price Analysis: Range-play extends on Easter, bearish bias still intact
- Bitcoin consolidates in a rectangle on the hourly chart.
- The No.1 coin awaits a fresh catalyst amid Easter lull.
- Path of resistance still appears to the downside.

Bitcoin (BTC/USD), the most dominant digital asset, has failed another attempt to sustain above the 6900 levels so far this Easter Sunday. The price turned south, thereafter, no flirting with daily lows just above the 0.68 handle, losing nearly 1% on the day. Despite the latest leg down, the no.1 continues to traverse in the recent trading range, as the bulls and bears are seen in a tug-of-war, in absence of fresh catalyst amid a typical Easter trading lull. Bitcoin is poised to settle the week almost unchanged while enjoying a market capitalization of $125.14 billion.
Technical Overview
BTC/USD 1-hour chart
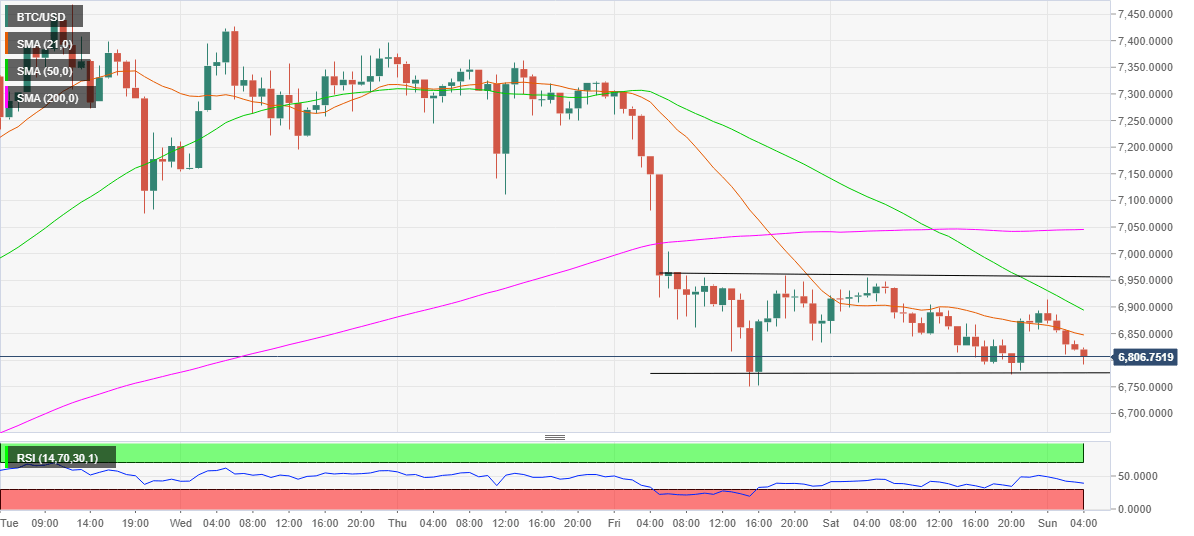
From a short-term technical perspective, the most favorite crypto coin is likely to extend its consolidative mode so long as it holds above Friday’s low of 6750.92. On the hourly chart, the price is locked within a potential rectangle pattern.
Although the path of least resistance appears to the downside. To add, the hourly Relative Strength Index (RSI) has turned lower below the midline, suggesting the bears will likely remain in control going forward. Meanwhile, a bunch of resistances is stacked up that is making it a difficult task for the bulls to attempt a move higher.
The immediate resistance awaits at the downward sloping 21-hourly Simple Moving Averages (HMA) of 6851.31 above which 6900, the intersection of the round figure and bearish 50-HMA will be tested. A move through the latter will bring the horizontal trendline resistance at 6955 back in play. The rectangle pattern bullish breakout will get confirmed should the price close above 6955 on an hourly basis, opening doors for a test of the critical horizontal resistance of the 200-HMA at 7045.
Alternatively, the bears have to take out the only demand area around 6775-6750, the confluence of the horizontal trendline support and Friday’s low, to resume last week’s corrective slide from monthly tops of 7468.81. A test of the 6600 level is inevitable on a failure to defend the abovementioned support zone.
BTC/USD technical levels to watch
Author

Dhwani Mehta
FXStreet
Residing in Mumbai (India), Dhwani is a Senior Analyst and Manager of the Asian session at FXStreet. She has over 10 years of experience in analyzing and covering the global financial markets, with specialization in Forex and commodities markets.


