Bitcoin price analysis: Its a breakout; 8,000 next?
- BTC breaks out on the long term charts.
- Next stop $7,800 and $8,000.

Bitcoin, the largest cryptocurrency and the poster boy of the crypto world, has managed to cross past a very strong resistance line on the long term chart apart from sustaining past some long term moving averages and now is headed towards next round figure mark of $8,000.
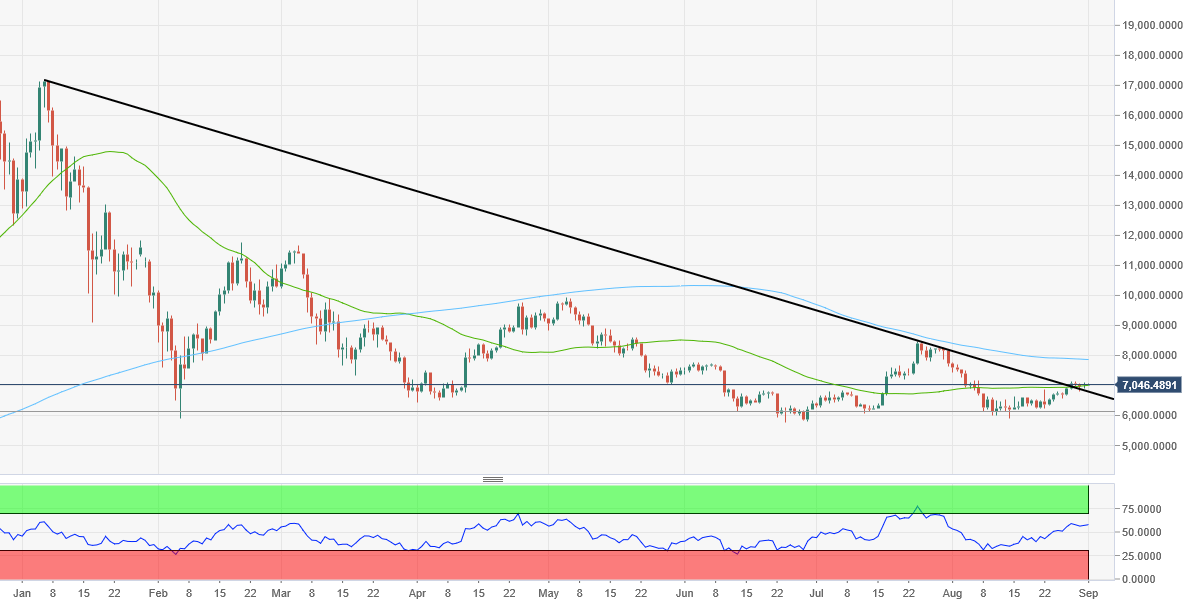
BTC/USD is up half a percent on day at $7,049 and trading in less than one percent range for the day. On the daily chart, BTC has been able to cross past one critical long term ascedning trendline resistance that has been very stiff since January this year.
Also, the fact that the prices have been able to sustain past 21 days and 50 days simple moving averages, gives enough confidence to the bulls to continue riding this upmove, all the way towards next MA at $7,860, 200 days simple moving average that is and then round figure mark of $8,000.
BTC/USD daily chart:
Get 24/7 Crypto updates in our social media channels: Give us a follow at @FXSCrypto and our FXStreet Crypto Trading Telegram channel
Author

Manoj B Rawal
Independent Analyst
Manoj B Rawal, financial markets professional with about 11 years of experience in writing, editing and advising on stocks, currencies and fixed income.


