Bitcoin price analysis: BTC/USD loses momentum at the double top pattern; gains limited below $6,700
- Bitcoin price is facing resistance at the 23.6% Fibonacci level, key resistance is at $6,700.
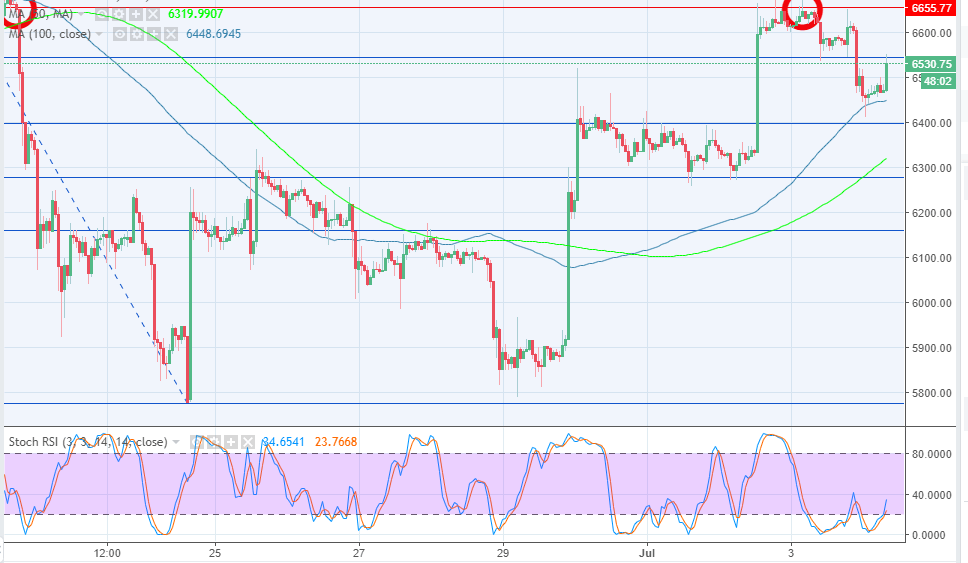
- Short-term support is at the 100 SMA while $6,400 will prevent further declines.

Bitcoin price is making subtle downside corrections on Wednesday after trading a double top pattern as observed on the chart. BTC/USD is down 0.50% on Wednesday, besides the declines have pushed it below $6,500. The price has been edging higher since June 29, in addition to forming a bullish flag pattern supported at $6,300 which culminated in a brief sharp movement that breached the resistance at $6,600 but has been limited below $6,700.
There is a weak bullish trend forming at the time of writing, however, it will encounter resistance at the 23.6% Fib retracement level with last swing high of $6,781 and a swing low of $5,772. The upper supply zone is highlighted at $6,600, but the buyers will encounter high selling activity at $6,700, but a break above this level could see BTC/USD attacking the coveted $7,000.
On the flipside, the 100 Simple Moving Average is providing immediate support at $6,448.53. Similarly, a stronger support zone is present at $6,400 which also coincides with the 38.2% Fibonacci retracement level. Most of the technical indicators signal that the buyers are gaining strength in the medium term and Bitcoin price will continue to retrace higher as well.
BTC/USD 1-hour chart
Author

John Isige
FXStreet
John Isige is a seasoned cryptocurrency journalist and markets analyst committed to delivering high-quality, actionable insights tailored to traders, investors, and crypto enthusiasts. He enjoys deep dives into emerging Web3 tren


