Bitcoin Price Analysis: BTC/USD hugging a critical trend line
- Bitcoin price is trading in positive territory, up 0.85% in the second half of the session.
-
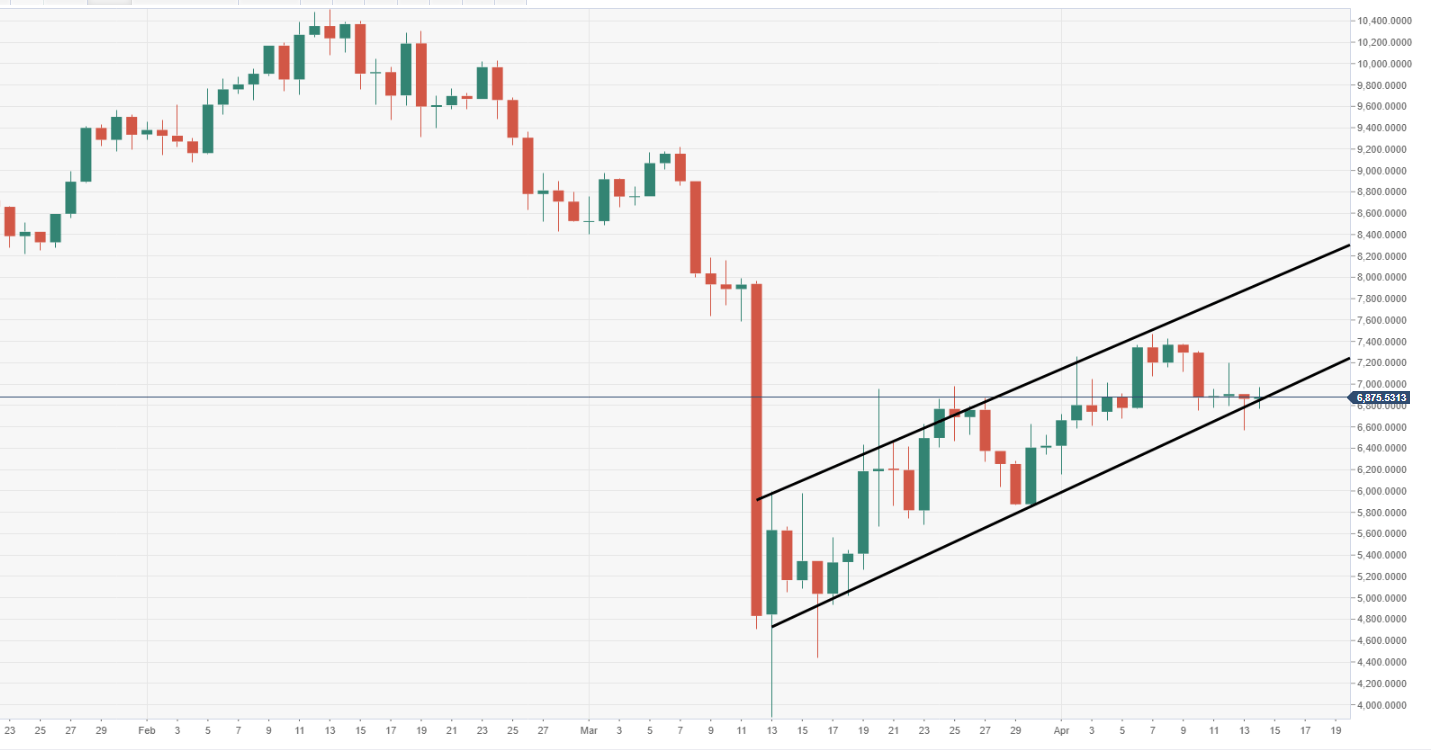
BTC/USD is flirting with the lower acting trend line of a possible bear flag.
-
Vulnerabilities remain tilted to the downside given the price is trading under $7000.

BTC/USD daily chart
Price action is moving within a bearish flag structure via the daily chart view at risk of a breakout to the downside.
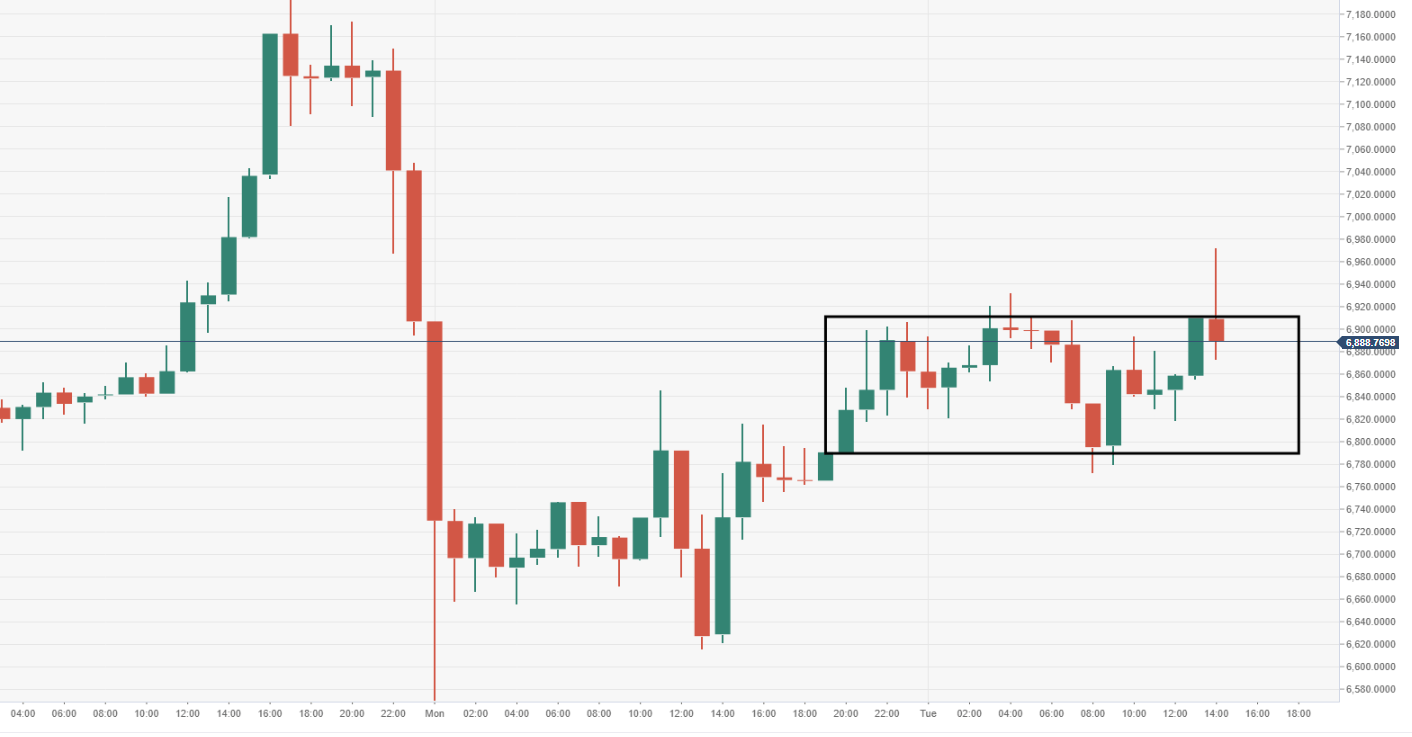
BTC/USD 60-minute chart
Price action is narrowing via the hourly view, capped by supply around the $6900 area.
Spot rate: 6921.85
Relative change: +0.85%
High: 6972.35
Low: 6772.07
Author

Ken Chigbo
Independent Analyst
Ken has over 8 years exposure to the financial markets. He started his career as an analyst, covering a variety of asset classes; forex, fixed income, commodities and equities.
More from Ken Chigbo


