|

Bitcoin Price Analysis: BTC/USD bulls set to make a critical break above last week’s high

  • Bitcoin price is trading in positive territory, up +1.40% in the second half of the session. 
  • BTC/USD bulls are firmly back into control following a break north of $8500 again.
  • A big boost for the bulls as the $9000 price mark is reclaimed. 

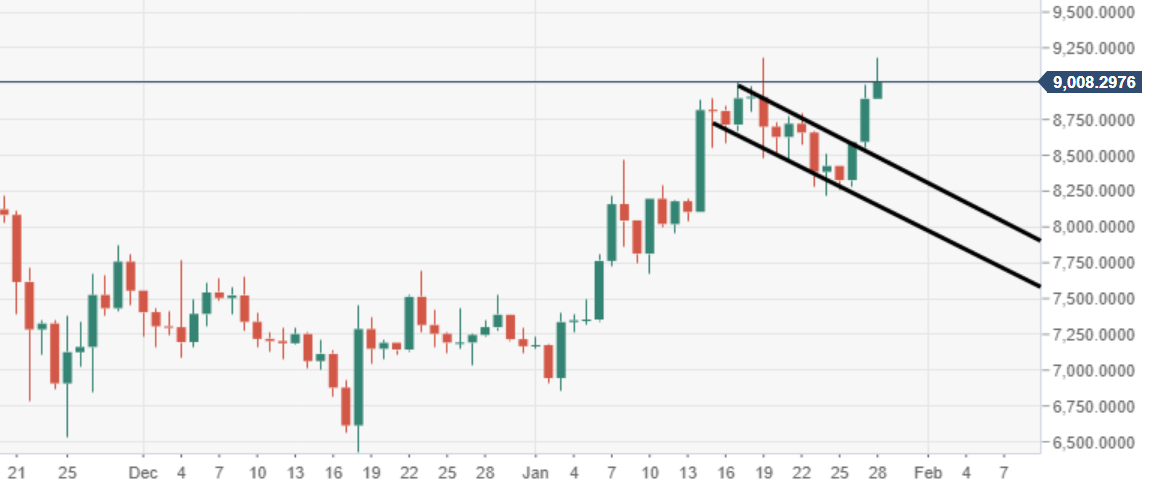
BTC/USD daily chart

Price action is heading for a big retest of last week’s high print up at $9190. Should the bulls successfully break above this, a further wave of upside momentum may very well follow. 
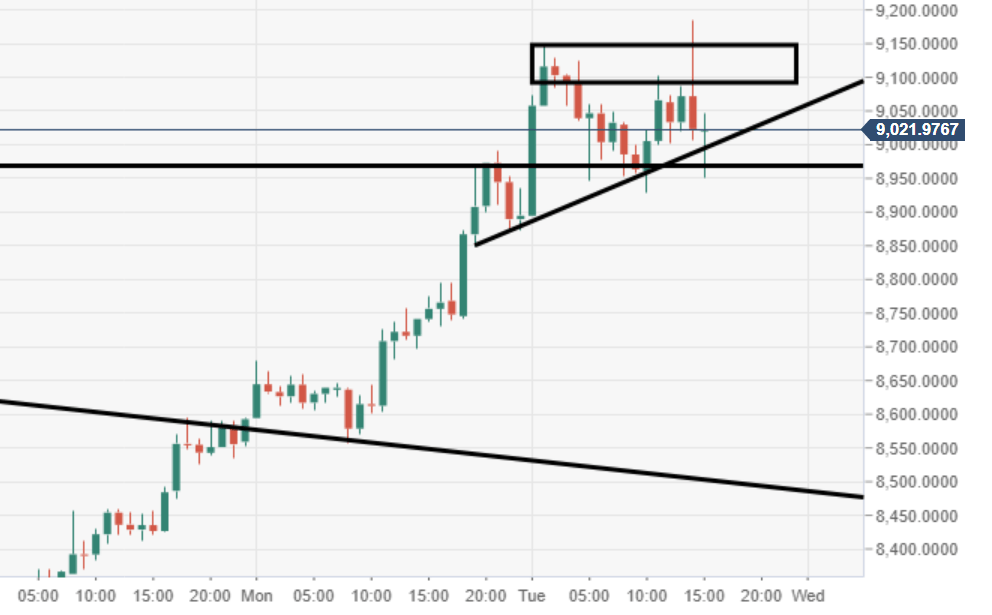
BTC/USD 60-minute chart

Supply observed via the 60-minute chart view is struggling with supply in the $9100-9150 region. 
Spot rate:                9009.70

Relative change:     +1.30%

High:                        9185.76

Low:                         8894.63

BTC/USD

Overview
Today last price9011.18
Today Daily Change116.54
Today Daily Change %1.31
Today daily open8894.64
 
Trends
Daily SMA208491.92
Daily SMA507746.83
Daily SMA1007973.72
Daily SMA2008962.37
 
Levels
Previous Daily High8991.54
Previous Daily Low8557.41
Previous Weekly High9184.59
Previous Weekly Low8217.49
Previous Monthly High7770.78
Previous Monthly Low6432.05
Daily Fibonacci 38.2%8825.7
Daily Fibonacci 61.8%8723.25
Daily Pivot Point S18637.51
Daily Pivot Point S28380.39
Daily Pivot Point S38203.38
Daily Pivot Point R19071.65
Daily Pivot Point R29248.67
Daily Pivot Point R39505.79

Author

Ken Chigbo

Ken Chigbo

Independent Analyst

Ken has over 8 years exposure to the financial markets. He started his career as an analyst, covering a variety of asset classes; forex, fixed income, commodities and equities.

More from Ken Chigbo

Share:

Editor's Picks

Bitcoin Weekly Forecast: BTC retreats as macro headwinds grow
Bitcoin (BTC) remains under pressure, down over 4% this week and trading around $76,900 at the time of writing on Friday. Institutional demand shows signs of weakness as spot BTC Exchange Traded Funds (ETFs) are on track to end their three-week inflow streak, recording nearly $500 million in net outflows through Thursday.
XRP falls toward key support as macro uncertainty, weak momentum cap recovery
Ripple (XRP) falls below $1.33 on Friday, marking the third consecutive day of declines. The token continues to track the broader cryptocurrency market downturn, with investors closely monitoring heightened macroeconomic uncertainty ahead of the United States (US) Consumer Price Index (CPI) release and next week’s Federal Reserve (Fed) monetary policy decision.
Crypto Today: Bitcoin, Ethereum, XRP stabilize at lower levels amid ETF outflows and macroeconomic risks
The broader cryptocurrency market is rising on Friday, with Bitcoin (BTC) trading above $77,000 after testing lower support near $76,500. Ethereum (ETH) shows signs of stability, hovering above the support provided at $2,400 despite capped upside at $2,500. Meanwhile, Ripple (XRP) holds above $1.33 after three straight days of declines, reflecting growing headwinds due to macroeconomic uncertainty.
Bitcoin pulls back as another golden cross fails to deliver
Earlier this week, Bitcoin formed a golden cross, a technical signal that occurs when the price’s 50-day moving average rises above the 200-day moving average and is conventionally viewed as a precursor to a bullish rally. Historically, however, that’s often not been the case.
Bitcoin: BTC retreats as macro headwinds grow
Bitcoin (BTC) remains under pressure, down over 4% this week and trading around $76,900 at the time of writing on Friday. Institutional demand shows signs of weakness as spot BTC Exchange Traded Funds (ETFs) are on track to end their three-week inflow streak, recording nearly $500 million in net outflows through Thursday.

