Bitcoin price analysis: BTC/USD bullish flag pattern heads into a breakout; the only way is up for now
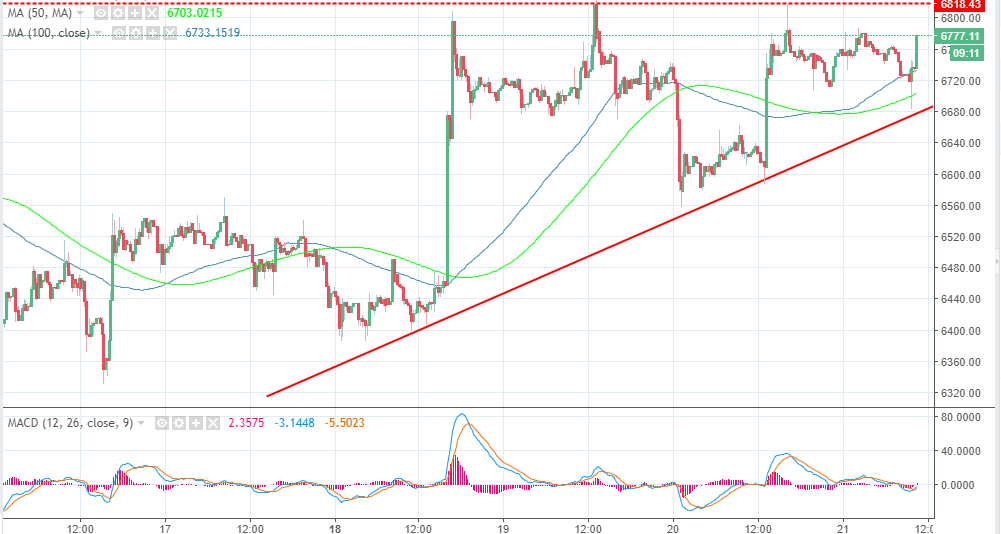
- Bullish trend in progress above $6,750 while the buyers are psychologically looking forward to $6,800
- The 50 SMA will offer support above the bullish trendline and the area at $6,680.

Bitcoin price is trading a short-term bullish flag pattern pending a possible upside breakout. The price is currently supported by the 100 Simple Moving Average at $6,730. There was a brief upside movement after opening the session on Thursday but bears entered close to $6,785 where the intraday gains have been capped today.
At the moment there is a bullish trend in progress above $6,750 while the buyers are psychologically looking forward to $6,800 in the medium-term. Moreover, Bitcoin price is forming a rising wedge pattern with the upper limit zone at $6,818. If the bulls break above this level, BTC/USD could test the next resistance level at $6,850 before gaining strength to attack the coveted $7,000 zone.
The MACD is recovering from the negative region while stochastic on the 15-minutes timeframe chart is moving further up to signal the heavy presence of buyers. On the flipside, BTC/USD is still supported at $6,730 - $6,720. The 50 SMA will offer support above the bullish trendline and the area at $6,680. A much stronger support is observed at $6,600 on the chart.
Author

John Isige
FXStreet
John Isige is a seasoned cryptocurrency journalist and markets analyst committed to delivering high-quality, actionable insights tailored to traders, investors, and crypto enthusiasts. He enjoys deep dives into emerging Web3 tren


