Bitcoin price analysis: BTC/USD breaches $8,500: Another bullish flag pattern could test $8,600
- Bitcoin price breaks above $8,500 to explore new April highs.
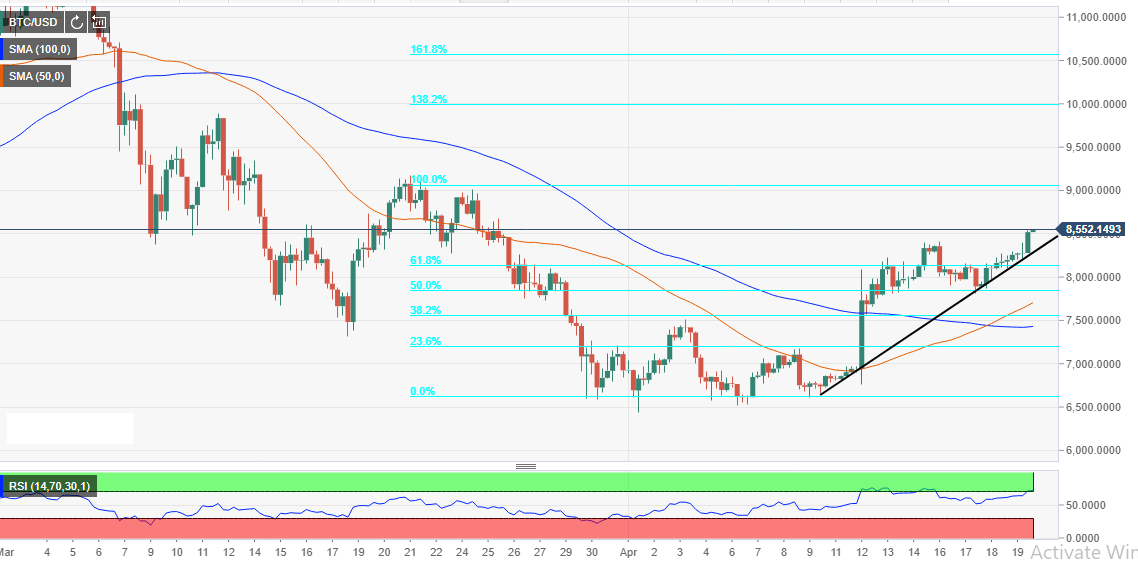
- 61.8% Fib to offer short-term support, $8,000 is a major support zone on the downside.

Bitcoin price has just broken above the short-term resistance level at $8,400. Moreover, the upside roll has also broken above $8,500. A continued bullish momentum could test $8,600 as BTC/USD retraces upwards towards the coveted $8,900.
The upside correction was initiated at $8,095 during yesterday’s trading sessions. There was increasing selling pressure at $8,200, but the Bulls held ground and push for further upside movements to explore new April highs.
Technical indicators like the RSI are starting to pull into the overbought levels to signal that BTC/USD could continue to correct higher in the near-term. The 50 SMA has crossed above the 100 SMA which could signal for more buyers to enter the market. There is a short-term support at $8,200; however, BTC/USD will be supported by the 61.8% fib retracement level with the previous swing high of $9,068 and a low of $6,630. Consequently, the pivotal $8,000 on a broader look will strongly support the largest cryptocurrency by market capitalization.
BTC/USD 5-hour chart
Author

John Isige
FXStreet
John Isige is a seasoned cryptocurrency journalist and markets analyst committed to delivering high-quality, actionable insights tailored to traders, investors, and crypto enthusiasts. He enjoys deep dives into emerging Web3 tren


