Bitcoin Price Analysis: BTC/USD bears take control, the price breaks below the SMA 20
- BTC/USD is currently consolidating in a triangle formation.
- The Elliott Oscillator has had five straight red sessions.

BTC/USD daily chart
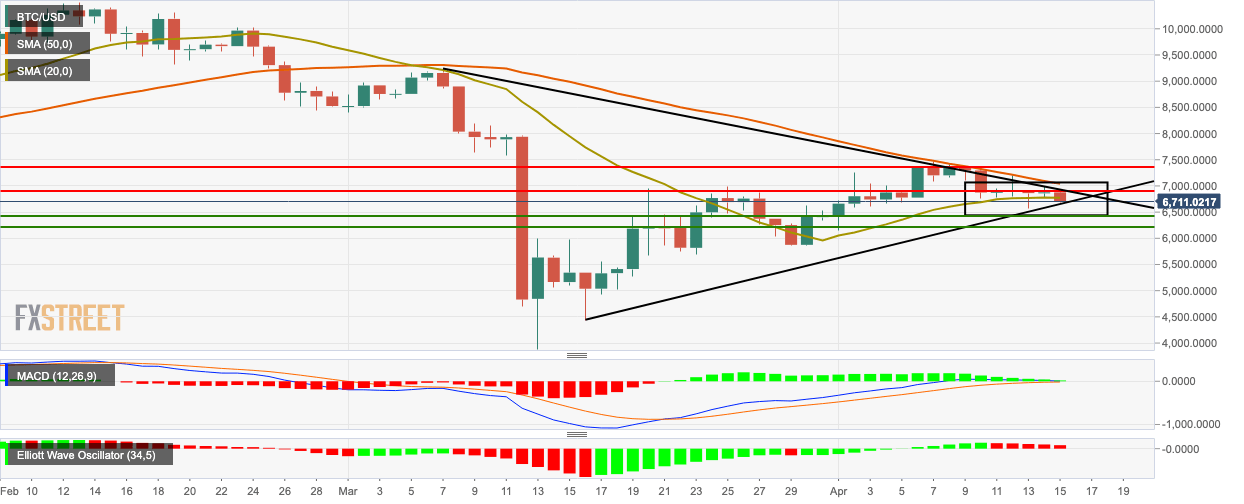
BTC/USD fell from $6,876.98 to $6,712.75 this Wednesday as it continues to consolidate in a triangle formation. The bearish price action dropped BTC/USD below the SMA 20 curve. The upward trending line needs to hold firm to inhibit further price drop. The MACD indicates decreasing bullish momentum, while the Elliott Oscillator has had five straight red sessions.
Key levels
Author

Rajarshi Mitra
Independent Analyst
Rajarshi entered the blockchain space in 2016. He is a blockchain researcher who has worked for Blockgeeks and has done research work for several ICOs. He gets regularly invited to give talks on the blockchain technology and cryptocurrencies.
More from Rajarshi Mitra


