Bitcoin Price Analysis: BTC enters danger zone as investors grow “extremely greedy”
- Bitcoin may be ripe for correction as the price reached overbought territory.
- Several technical factors flash red signals for BTC.

Bitcoin (BTC) broke above the psychological barrier of $15,000 and stopped within a whisker of $16,000 during early Asian hours on Friday. The pioneer digital currency hit the highest level since January 2018. Bitcoin's average daily trading volume settled at $75 billion, while its market share increased to 65.5%, which is the highest level since June. On a day-to-day basis, the coin gained nearly 10%, while the weekly gains amounted to 19%.
The market is still enthusiastic about BTC, as "fear of missing out" (FOMO), comparable with the market fever of 2017, is gaining steam. However, several on-chain and technical metrics are signalling that Bitcoin has entered a danger zone, and the correction may be underway.
The market turns extremely greedy
The Fear and Greed Index has hit 90, meaning that the market is in a state of extreme greed. The index is based on a combination of data points, including volatility, social media, and Google trends, that allow evaluating the aggregated market sentiments. If it moves closer to zero, the market is extremely fearful, while 100 means "Extreme Greed".
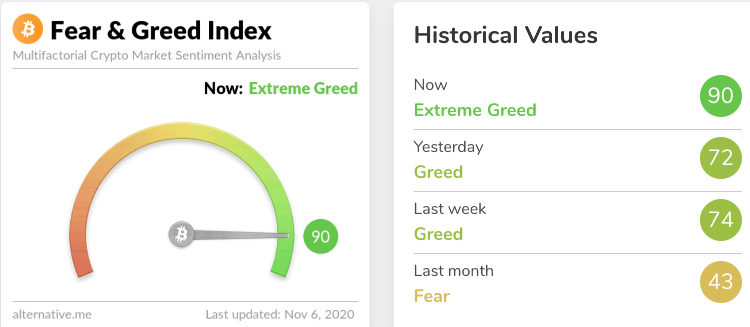
Fear and Greed Index, Alternative.me
The cryptocurrency market is vulnerable to emotional behaviour, resulting in FOMO or FUD (Fear, Uncertainty, Disbelief). They tend to get greedy, buy more coins when the prices are high, and dump their assets when the market turns red, exacerbating the decline.
The Fear and Greed Index helps avoid herd behaviour and make rational decisions, buying when the asset is undervalued and selling when it is ripe for a correction. "Be fearful when others are greedy and greedy when others are fearful" – this observation made by famous investor Warren Buffet can be applied to the cryptocurrency markets environment.
Bitcoin may be on the verge of a deep correction as the index has reached a territory of extreme greed. Historically, the index reached these levels only in December 2017 and January 2019, which was followed by a massive collapse and a depressing crypto winter that lasted for nearly a year. In June 2019, the market came close to the overhyped territory, resulting in a deep sell-off.
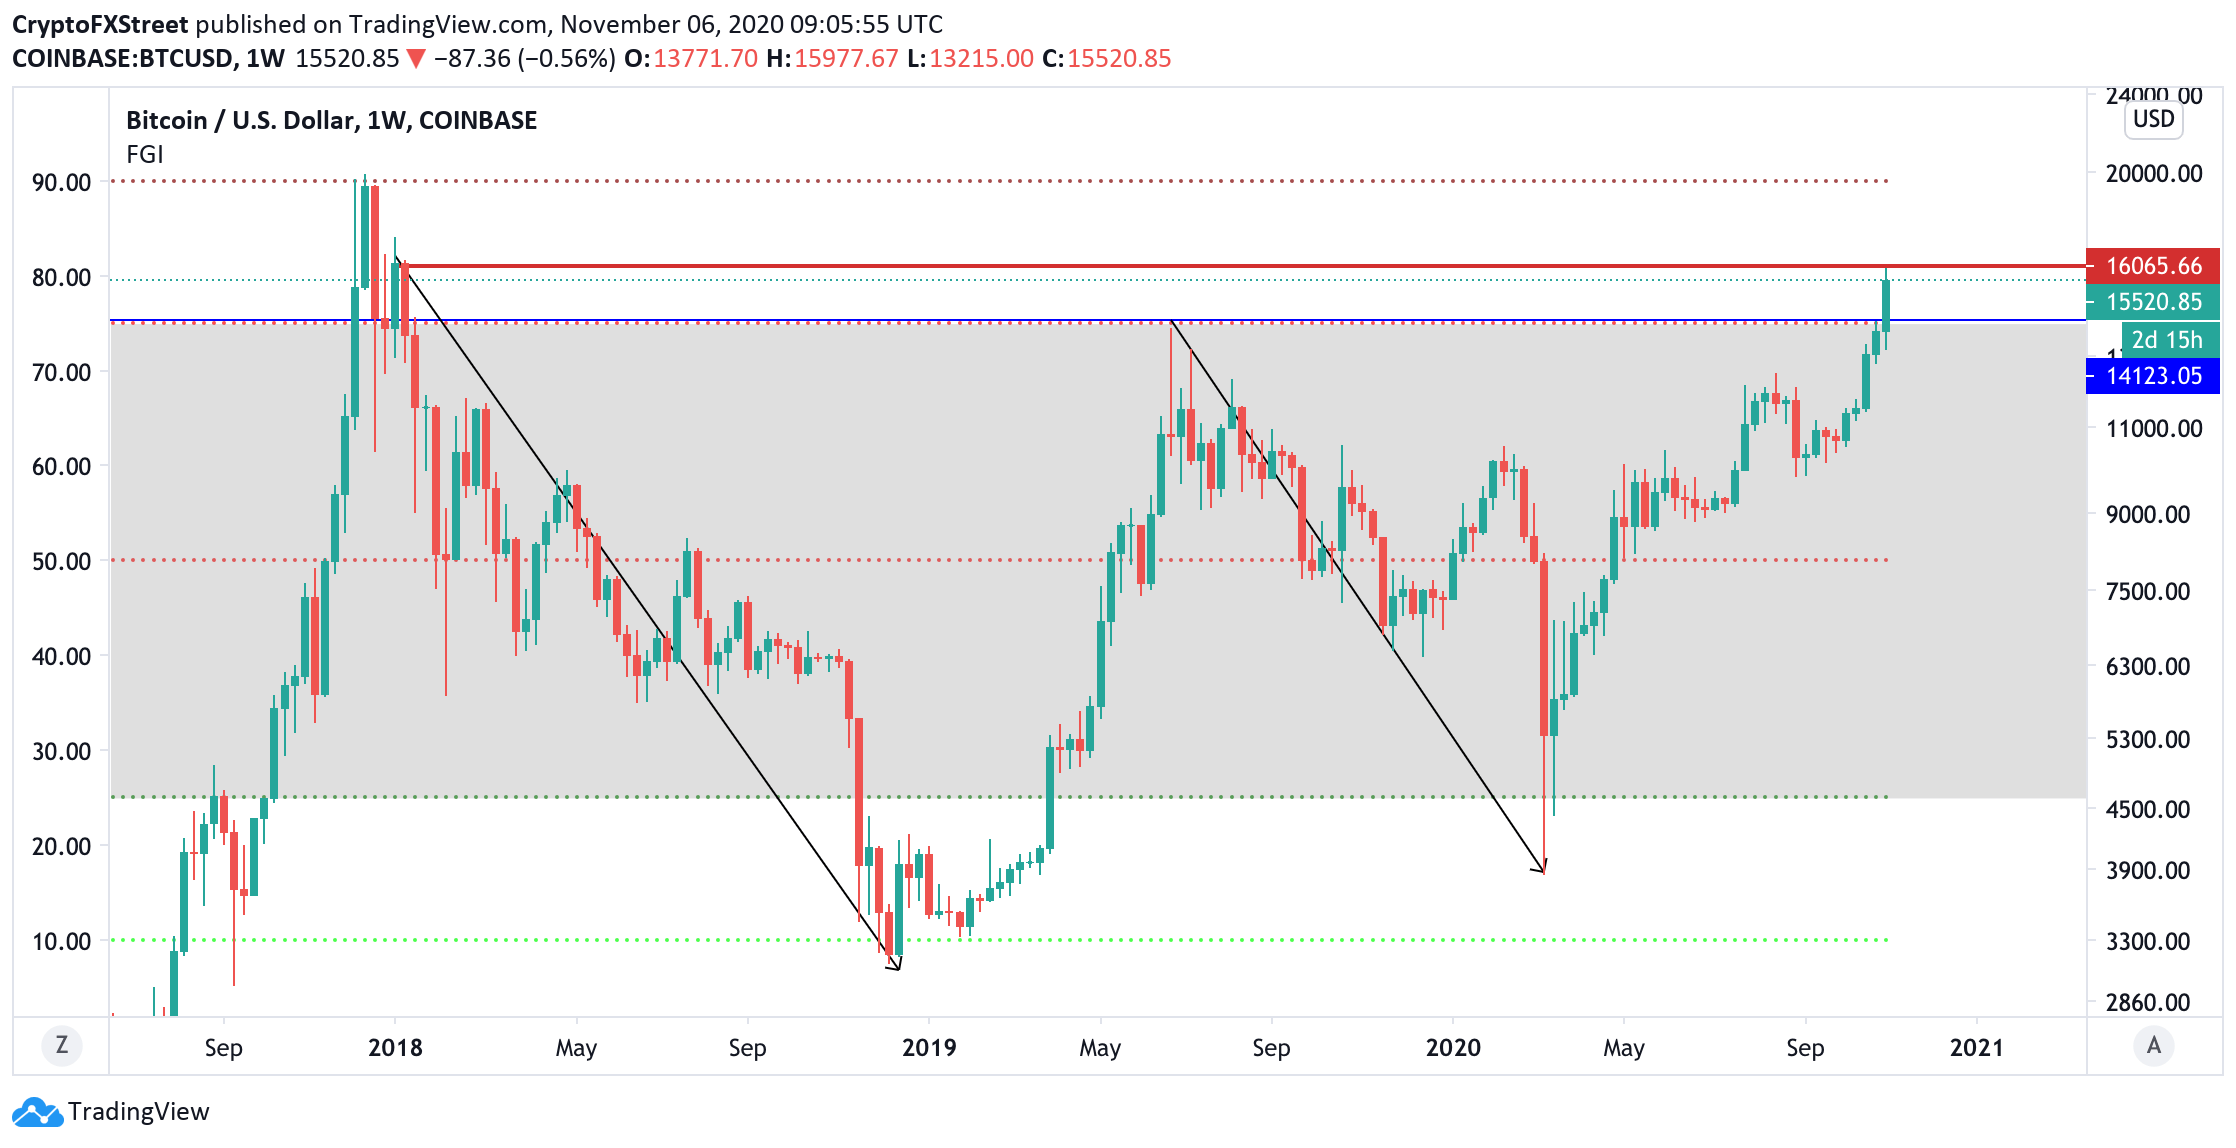
BTC/USD weekly chart
Bitcoin miners are ready to sell
Bitcoin miners have started to cash out, which is another signal of the upcoming bearish correction. According to the data provided by CryptoQuant, the Miner to Exchange Transactions Count Flow indicator has been creeping higher, meaning that the dumping risk from miners is growing.
However, the experts note that the danger zone starts at 120 transactions. When the hourly value goes above this threshold, a significant sell-off similar to the one that happened in March may start.
It seems miners started to sell some $BTC.
— CryptoQuant.com (@cryptoquant_com) November 5, 2020
You might want to set an alert for "Miner to Exchange Transactions Count Flow." $BTC price drops when this hourly value goes above 120. The great sell-off in March this year, for example.
Set alerthttps://t.co/ZOxePE7aFm pic.twitter.com/3lFrJicvV0
TD Sequential indicator produces a sell signal
The TD Sequential indicator presented a sell signal on BTC's 4-hour chart, adding credence to the potential correction. The bearish formation developed as a green-nine candlestick, anticipating a one-to-four three-day candlesticks correction. A red-two candlestick trading below a preceding red one candle confirms that Bitcoin is poised to drop further with the local target at psychological $14,000. This barrier served as a resistance area at the beginning of November and now may be verified as support.
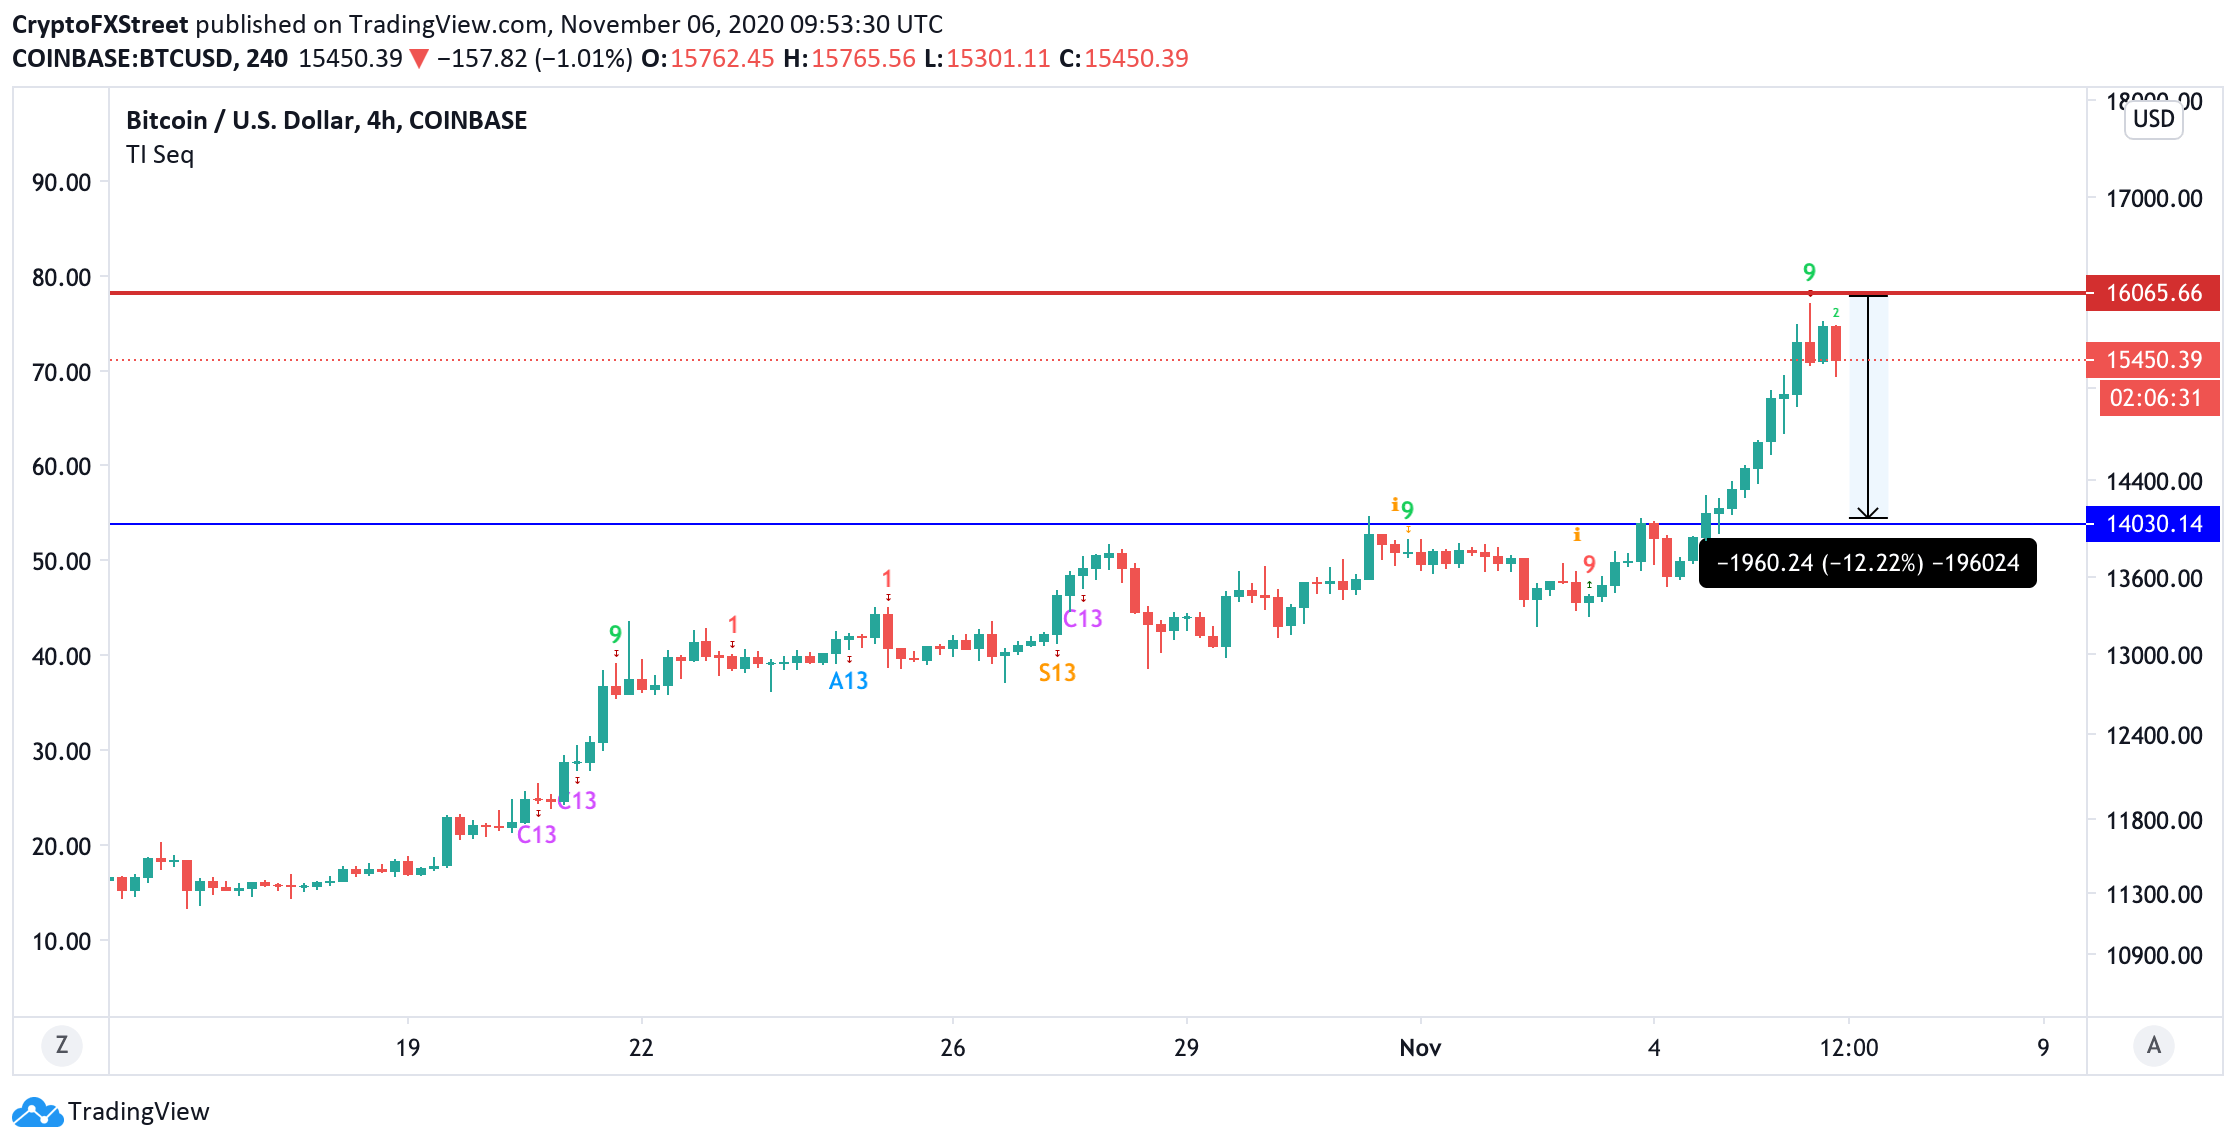
BTC/USD 4-hour chart
Meanwhile, the In/Out of the Money Around Price (IOMAP) model shows that there are no major barriers above the current price, while the downside is clustered with significant supply.
 Analytics and Charts 0611-637402549010520794.png)
Bitcoin's IOMP data
Thus, there is strong support between $14,500 and $14,90 as over 500k addresses previously purchased over 400k BTC around that price. The next big cluster of addresses is registered below $14,000.
Key levels to watch
A short-term technical correction may take BTC/USD to $14,000. However, this barrier is likely to stop the sell-off and attract new buyers to the market. Considering the lack of resistance levels above the current price, BTC may resume the growth and clear $16,000. On the other hand, on-chain metrics imply that the price is close to overbought levels, which means the downside correction may be around the corner.
Author

Tanya Abrosimova
Independent Analyst


