|

Bitcoin Price Analysis: Bears look set to test key support circa $10,080

  • BTC sellers return on Saturday amid profit-taking spree.
  • Technical set up paints a bearish picture in the near-term.
  • BTC/USD hit a new five-month high at 10,511.86 on Thursday.

The BTC sellers have regained control on Saturday, after attempting another test of a new five-month high reached at 10,511.86 last Thursday. Bitcoin (BTC/USD), the most favorite cryptocurrency, holds the lower ground on the 10k level, extending its recent consolidative mode. The spot, currently, exchanges hands at 10,240, losing 1.30% on the day while up nearly 4.50% on a weekly basis. Its market capitalization stands at to $186.27 billion, at the time of writing.

Technical Overview

BTC/USD hourly chart
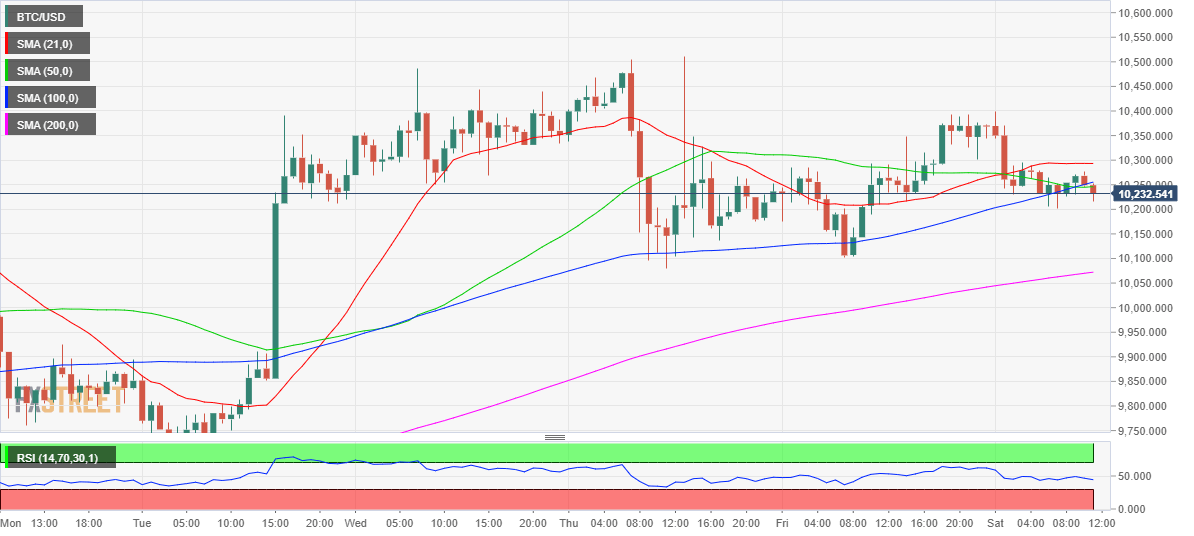
As observed in the hourly chart, the price wavers in a narrow range between 10,300-10,200 so far this Saturday, having witnessed a 180-pips steep drop in the overnight trades. Since then the price has kept its range below the 21-hourly Simple Moving Average (SMA), now at 10,293 levels. Only a sustained break above the latter would revive the bulls in the near-term, paving the way towards the multi-month tops.  

However, the prices, as of now, continue to battle the key resistance located around 10,250, the confluence of the 50 and 100-HMAs. Meanwhile, the hourly Relative Strength Index (RSI) has breached the mid-line from above and points south, suggesting that the downside appears more compelling.

Also, the No.1 coin lacks significant support, as the bears now look forward to testing the next support of 200-HMA at 10,076, around which the buyers found support in the last two trading sessions.   

BTC/USD key levels to watch

BTC/USD

Overview
Today last price10238.60
Today Daily Change-129.10
Today Daily Change %-1.25
Today daily open10369.38
 
Trends
Daily SMA209623.66
Daily SMA508664.39
Daily SMA1008166.18
Daily SMA2008879.52
 
Levels
Previous Daily High10392.42
Previous Daily Low10101.44
Previous Weekly High10511.86
Previous Weekly Low9707.96
Previous Monthly High9568.13
Previous Monthly Low6856.63
Daily Fibonacci 38.2%10281.27
Daily Fibonacci 61.8%10212.59
Daily Pivot Point S110183.07
Daily Pivot Point S29996.76
Daily Pivot Point S39892.08
Daily Pivot Point R110474.06
Daily Pivot Point R210578.74
Daily Pivot Point R310765.05

Author

Dhwani Mehta

Dhwani Mehta

FXStreet

Residing in Mumbai (India), Dhwani is a Senior Analyst and Manager of the Asian session at FXStreet. She has over 10 years of experience in analyzing and covering the global financial markets, with specialization in Forex and commodities markets.


More from Dhwani Mehta
Share:

Editor's Picks

Why altcoin season isn't coming back — and what stole its capital

If, after two years of being frozen in ice, Katara and Sokka woke you up to the crypto market, it would seem like 100 years have passed. With Bitcoin soaring to record highs just over a year ago, everyone expected a routine altcoin season, where investors take profits from the top crypto to chase higher returns in altcoins.

Bitcoin Weekly Forecast: BTC shrugs off CLARITY Act setback and hawkish Fed

Bitcoin recovers, trading above $78,000 on Friday, but the 50-week SMA near $78,760 continues to cap its upside. A hawkish Fed outlook, escalating Middle East tensions, and the CLARITY Act's failure to advance in the US Senate could limit BTC upside.

Why Bitcoin's over 30% rebound doesn't mean the bear market cycle is done

BTC has staged a strong recovery after falling to a yearly low of $57,800 in July, gaining nearly 33% and recording two consecutive months of gains in July and August. Is this the start of a new bullish phase, or simply another recovery within a broader bear-market cycle?

Crypto Today: Bitcoin, Ethereum, XRP eye short-term breakout as bulls return

Bitcoin trades higher near $78,000 on Friday as bulls return after early-week macro uncertainty and regulatory headwinds. Ethereum aligns with the broader crypto market’s neutral-to-bullish outlook, holding support above $2,400 and gaining momentum for a short-term breakout at $2,500.

Bitcoin: BTC shrugs off CLARITY Act setback and hawkish Fed
Bitcoin (BTC) price action has remained resilient this week, trading above $78,000 at the time of writing on Friday, heading toward a key resistance zone. Institutional demand shows early signs of weakness, with spot Exchange Traded Funds (ETFs) on track for a second straight week of outflows, with over $420 million recorded through Thursday amid escalating Middle East tensions.

