|

Bitcoin price analysis: Another bearish flag pattern in play

  • Reaction to the short-bearish flag pattern could send Bitcoin back below $3,500.
  • Bitcoin volatility is still high even as the market stays stable.

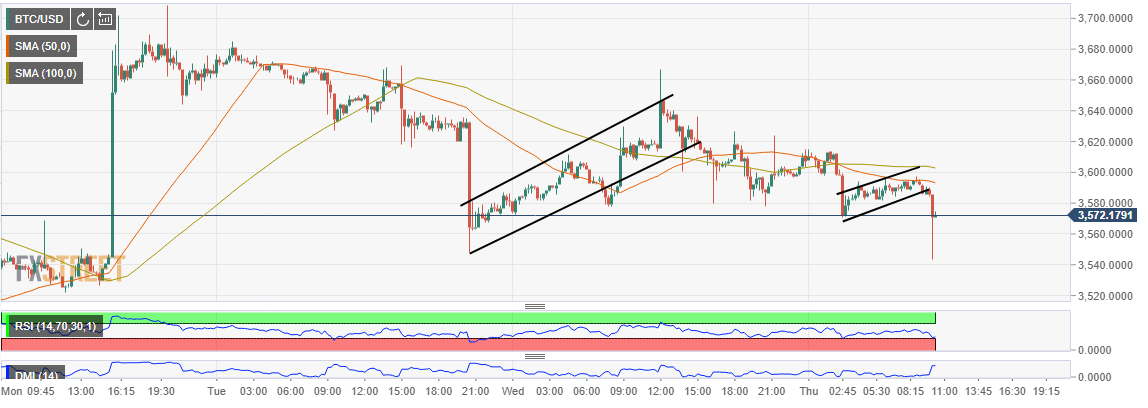
The market has been stable since the devastating drop last week. However, Bitcoin volatility is still high. The asset succumbed to another drop on Tuesday this week where after it was rejected from $3,680. The bullish flag pattern we explored in the price analysis then failed to breakout resulting in an extended breakdown that tested the short-term support at $3,560.

While the correction towards $3,700 has been limited, Bitcoin buyers pushed the price higher above $3,640. The bearish flag pattern formed saw Bitcoin correct lower as expected. At the moment, BTC/USD is trading below the 50-day Simple Moving Average in the 1-hour range. BTC is valued at $3,584.20 while there is an ongoing bear momentum as seen in the chart.

The bear momentum is an expected reaction to the short-term bearish flag pattern. It is likely that that Bitcoin will continue to trend lower in the coming sessions of the day. The Relative Strength Index (RSI) is on verge of exploring the oversold territory. This means that the bears are back and in full gear. However, a couple of support areas at $3.560 and $3,540 will come in handy to rescue the bulls from the impending downfall.

BTC/USD 1-hour chart

Author

John Isige

John Isige

FXStreet

John Isige is a seasoned cryptocurrency journalist and markets analyst committed to delivering high-quality, actionable insights tailored to traders, investors, and crypto enthusiasts. He enjoys deep dives into emerging Web3 tren

More from John Isige
Share:

Editor's Picks

XRP sell-off deepens amid weak retail interest, risk-off sentiment

Ripple (XRP) is edging lower around $1.36 at the time of writing on Wednesday, weighed down by low retail interest and macroeconomic uncertainty, which is accelerating risk-off sentiment.

Crypto Today: Bitcoin, Ethereum, XRP extend sell-off amid negative funding rates 

Bitcoin is down 15% in February and looks poised to extend its losses toward the yearly low of $60,000. Ethereum and Ripple are following in Bitcoin's footsteps, weighed down by a weak derivatives market. 

Hyperliquid tests key support as sell-side pressure intensifies

Hyerliquid (HYPE) drops to its 50-day Exponential Moving Average (EMA) at $28.85 at the time of writing on Wednesday, extending a decline of roughly 10% so far this week. 

Stellar Price Forecast: XLM risks revisiting $0.136 as sell-off continues

Stellar is trading below $0.160 at the time of writing on Wednesday, extending its correction for the fifth consecutive day. The bearish price action is further supported by rising short bets and declining Open Interest in the derivatives market. 

Bitcoin Price Annual Forecast: BTC holds long-term bullish structure heading into 2026

Bitcoin (BTC) is wrapping up 2025 as one of its most eventful years, defined by unprecedented institutional participation, major regulatory developments, and extreme price volatility.

Bitcoin: The worst may be behind us

Bitcoin (BTC) price recovers slightly, trading at $65,000 at the time of writing on Friday, after reaching a low of $60,000 during the early Asian trading session. The Crypto King remained under pressure so far this week, posting three consecutive weeks of losses exceeding 30%.