Bitcoin Price Prediction: Renowned trading veteran says BTC is ready for a new bull run
- BTC has finally broken above the symmetrical triangle pattern.
- The price has managed to cross over the 50-day SMA during this breakout.

The community is buzzing right now after Square’s announcement that they have purchased $50 million in Bitcoin. Well-know trading veteran, Peter Brandt, confirms that BTC is well-positioned to kickstart a new bull run.
It is a major development that a global corporation is now putting $BTC onto its balance sheet. The weekly and daily charts a poised to flash a big buy signal. https://t.co/p6652SfqVc pic.twitter.com/rCoKZCY5LB
— Peter Brandt (@PeterLBrandt) October 8, 2020
This overall positive sentiment has finally lifted the price above the symmetrical triangle pattern. With BTC currently priced at ~$10,900, it looks like the month-long consolidation that the price was going through is finally over following today’s bullish breakout.
BTC daily chart
-637377959889663783.png)
By measuring the distance between the high and low of the triangle, we can predict a target for the breakout, which, in this case, turns out to be ~$12,500. The first notable barrier for the bulls was the 50-day SMA curve that they have already broken past. The next level, as defined by the IOMAP, is the $11,700 resistance line.
BTC IOMAP
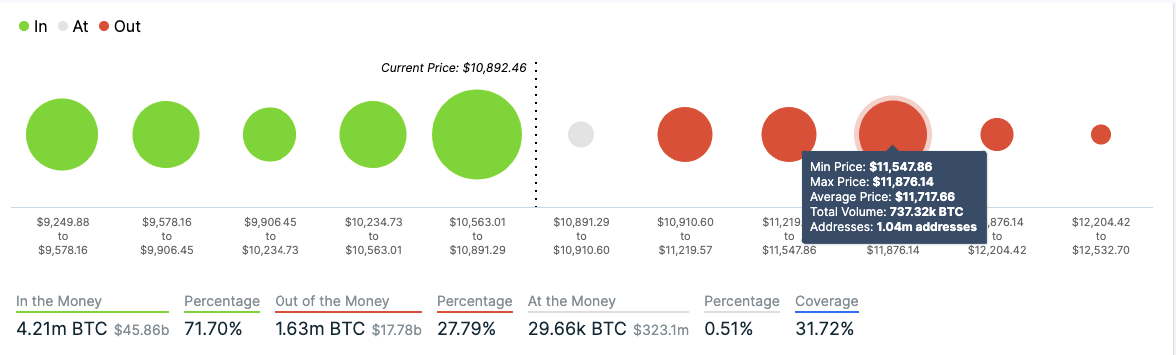
IntoTheBlock’s “In/Out of the Money Around Price” (IOMAP) is a handy tool that helps us visualize strong resistance and support levels. As per the tool, there is a strong resistance wall at $10,700, wherein 1 million addresses had previously purchased ~740,000 BTC. If the buyers break past this level, they should easily reach our target of $12,500 and beyond.
The MACD in the daily chart shows increasing bullish momentum, which should give the buyers enough firepower to break past this resistance wall.
Santiment’s holder distribution chart further supports our bullish hypothesis.
BTC holder distribution
 [04.02.41, 09 Oct, 2020]-637377960613749010.png)
The holder distribution chart helps us see the number of addresses holding a specific amount of tokens. If the number of whales, aka holders with millions of dollars worth of BTC, is increasing, then that’s a positive sign for the network. As per the chart, the number of addresses with >10,000 BTC has gone up by 6 over the last seven days. This shows that instead of selling off their coins, the whales are accumulating and strengthening their positions.
Now, let’s set a long-term price target for Bitcoin by looking at the weekly chart.
BTC/USD weekly chart
-637377960913905547.png)
As one can see, BTC is consolidating in a symmetrical triangle pattern in the weekly chart. By applying the same logic as we did in the daily chart, we can put a long-term target for a bullish breakout. In this case, a successful breakout can empower the buyers to take the price up to $21,500, beating the current all-time high for BTC (~$20,000). The 50-week, 100-week, and 200-week SMA curves are hovering comfortably below the price, so there aren’t any significant resistance levels that could thwart our project price action.
The flipside - Can the bears spoil the party here?
So, what can the bears do to ruin our optimistic price projection? If they somehow take control right now, the downside action will be severely limited by the 50-day SMA curve. Even the IOMAP shows that a strong support wall lies around the area where the 50-day SMA is hovering right now (~$10,800) since 2.25 million addresses had previously purchased around 1.6 million BTC at this level.
Even if the bears somehow break below this level, the IOMAP visualizes more healthy support levels below that will likely absorb any residual selling pressure.
Verdict: BTC has broken above the symmetrical triangle to end its >1 month consolidation period. The immediate target for the bulls appears to be $12,500. In the long-term, the price may break past the all-time high level and reach $21,500, provided they can sustain the current positive sentiment. The downside seems to be capped at $10,800 by the SMA 50 curve.
Author

Rajarshi Mitra
Independent Analyst
Rajarshi entered the blockchain space in 2016. He is a blockchain researcher who has worked for Blockgeeks and has done research work for several ICOs. He gets regularly invited to give talks on the blockchain technology and cryptocurrencies.



