Bitcoin HODLer? Fundstrat's experts know when its time to give up
- Bitcoin recovers from recent lows, but experts believe the sell off may be resumed
- BTC/USD settles above $3,500, ready to consolidate gains.

Bitcoin staged a nice recovery on Monday to trade at $3,534 at the time of writing. The first digital coin has gained over 8% in recent 24 hours amid global cryptocurrency market recovery triggered mainly by technical and speculative factors - just like an overwhelming majority of all major moves on the cryptocurrency market.
Long-term bears, be on the alert
Fundstrat Global Advisors technical analysts believe, that it is too early to claim that Bitcoin has bottomed out. Moreover, they know, where long-term bulls should eventually give up their longs.
“While it’s premature to conclude a longer-term low is developing it is noteworthy/encouraging to see BTC beginning to respond to its next support level. We would recommend traders now use the 200-week sma [simple moving average] near between $3,100 and $3,200 as a stop-loss level to manage long side risk,” Rob Sluymer wrote in the recent note.
Bitcoin's intraday technical picture
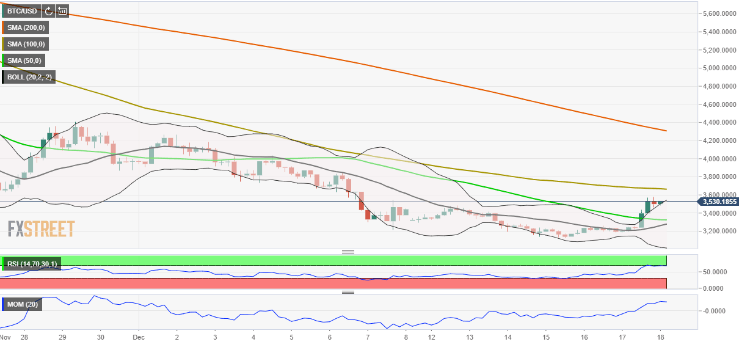
On the 4-hour chart, BTC/USD jumped above SMA50 and Bollinger Band 4-hour Mid-line, which is a good short-term signal. The price traded aboce Bollinger Band 4-hour Upper-line for a fraction of time, though it has returned inside tha Band by the time of writing. This is a natural development, however, it may signal that we have faced a strong resistance on approach to $3,600. Once it is cleared, Bitcoin will proceed towards the next hurdle created by SMA100 (4-hour) at $3,675.
On the downside, the first support area is created by a confluence of the above-said SMA50 ($3,324), psychological $3,300, and Bollinger Band 4-hour Mid-line ($3,378). Once below, the sell-off mau gain traction and take the price towards $3,200.
The Relative Strength Index stays flat, close to the overbought territory.
BTC/USD, 4-hour chart
Author

Tanya Abrosimova
Independent Analyst


