Bitcoin Gold Technical Analysis: BTG/USD pokes through $11 after a massive 10% rally
- BTG/USD is up 10.4% in the last 24 hours.
- BTG hit a high of $11.44, the highest point since the beginning of March.

BTG/USD had an explosive bull breakout on June 28 going from a low of $7.89 to $11.28. On June 29, BTG saw a continuation towards $11.44 but got rejected again droppìng to the current level of $10.21 still way above the daily 12-EMA and the 26-EMA which have just crossed bullishly.
BTG/USD 4-hour chart
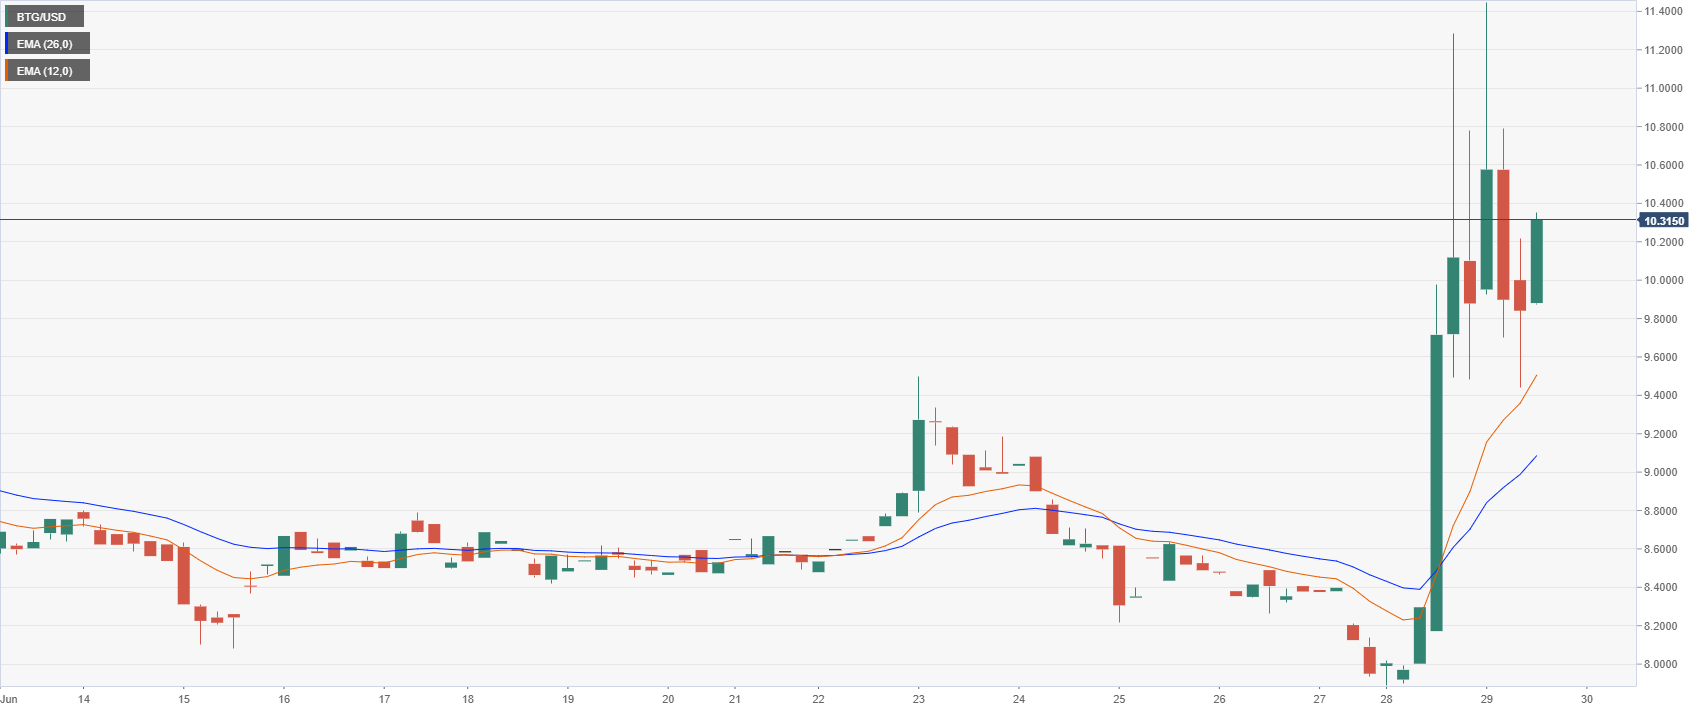
Clearly, BTG has changed its 4-hour trend to an uptrend and it’s now looking for a healthy consolidation before another leg up. The levels to watch are $10.78 resistance level and the $11 psychological level as well as the high at $11.44. For support, BTG can use the $9.44 low and the 12-EMA currently established at $9.5 followed by the 26-EMA at $9.08.
BTG/USD 1-hour chart
-637290420826820296.png)
The hourly chart is inside an equilibrium pattern that had a small fakeout towards $9.4. Buyers are no pushing BTG towards $11 and if they fail, they will establish a clear lower high and confirm the equilibrium pattern.
BTG/USD technical levels
Author

Lorenzo Stroe
Independent Analyst
Lorenzo is an experienced Technical Analyst and Content Writer who has been working in the cryptocurrency industry since 2012. He also has a passion for trading.


