Bitcoin, Ethereum, Ripple price prediction for today: BTC/USD likely to gravitate between $8605 and $9090
- BTC/USD concentrates its key levels in the area between $8605 and $9090
- ETH/USD has a strong zone of support at $570. XRP/USD with key support at $0.63, resistance at $0.73

We are using one of the latest tools that we have incorporated to FXStreet, the Technical Confluences Indicator (TCI). It is a bar chart that calculates, through an algorithm, the price areas where multiple technical variables are converging, such as SMAs, Bollinger bands or Fibonacci levels.
BTC/USD TCI Daily chart
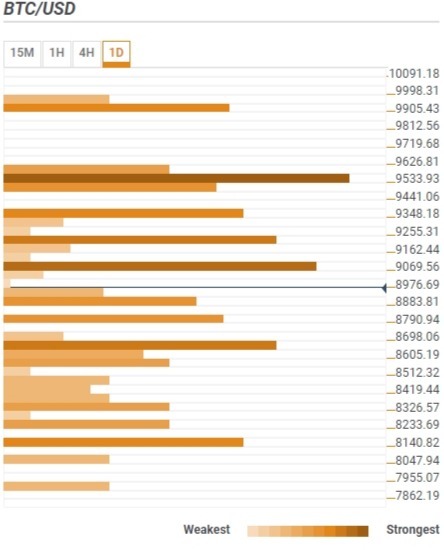
Yesterday, BTC/USD made an interesting bullish swing that has taken the Bitcoin price above the short-term moving averages, up to a new trading region in a bullish setup that could go on for the next trading sessions.
Today, a natural corrective movement confirming the price action should take place, taking the price back to the $8550-$8670 area. Strong resistance is set at $9069, followed by a series of levels at $9200, $9350 and, at last, a new important resistance at $9540.
BTC/USD 1H chart
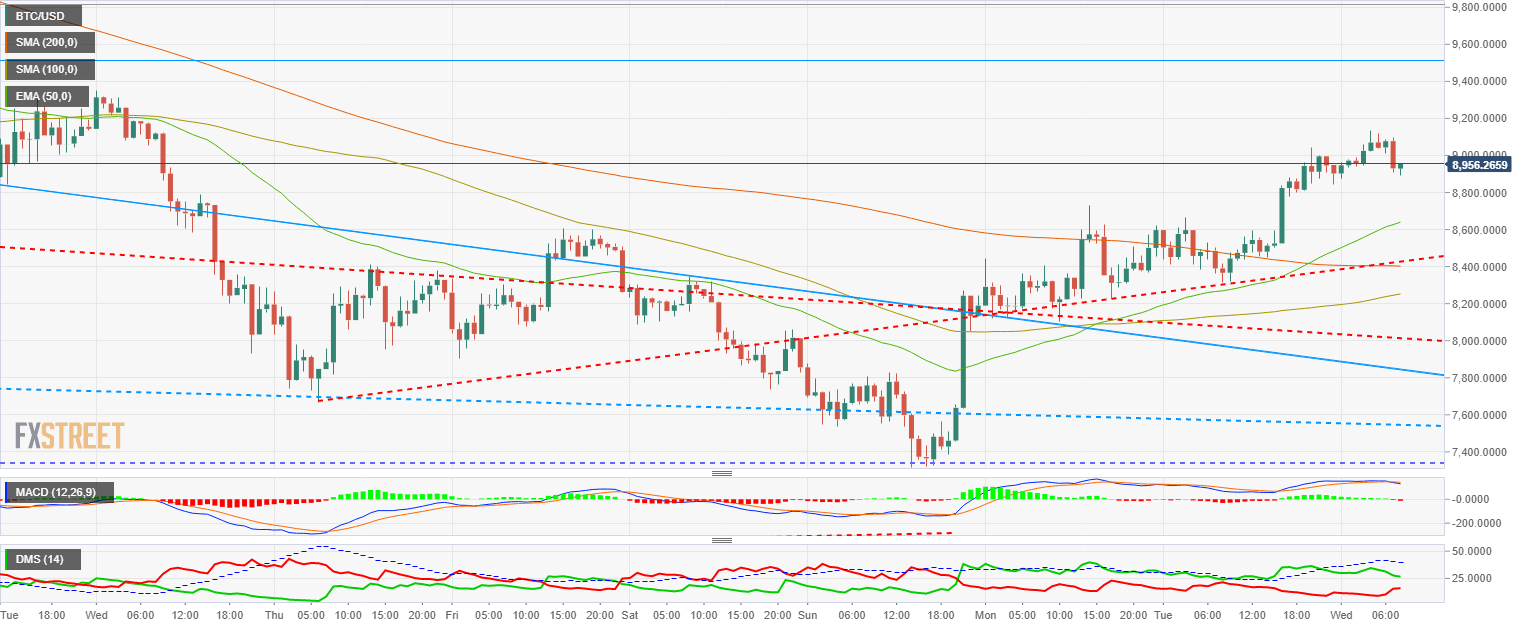
MACD in the Bitcoin 1-hour chart is crossed to the downisde after the recent bullish move. It will probably go searching the equilibrium line before bouncing back up and continuing upwards.
Directional Movement Index shows a certain degree of ease in the buying forces, with a moderate rise of the sellers. ADX is losing steam and confirming the possible movement of retracement/confirmation.
ETH/USD TCI Daily chart
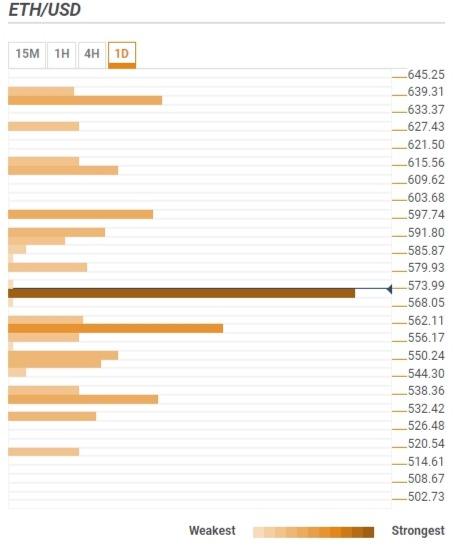
ETH/USD has broken above a strong resistance at $570 during the Asian session and is now trading above that level, now a support. In case of a retracement below there, next meaningful support would be at $558. On the upside, first slight resistance is set at $579, followed by $590. The most important resistance is found at $597.
ETH/USD 1H chart
-636572241540329759.png)
MACD in the Ethereum 1-hour chart is still crossed to the upside, but with a bearish profile that might bring the indicator to the downside at the start of the American session. If such scenario is confirmed, ETH/USD would enter a similar phase than BTC/USD, a consolidation of the previous wins.
Directional Movement Index still keeps giving advantage to the buyers, moving above the ADX, which statistically favors bullish movements. Sellers have increased once the price has reached the 200-SMA in a profit-taking move from lows. ADX is showing a weak trend.
XRP/USD TCI Daily chart
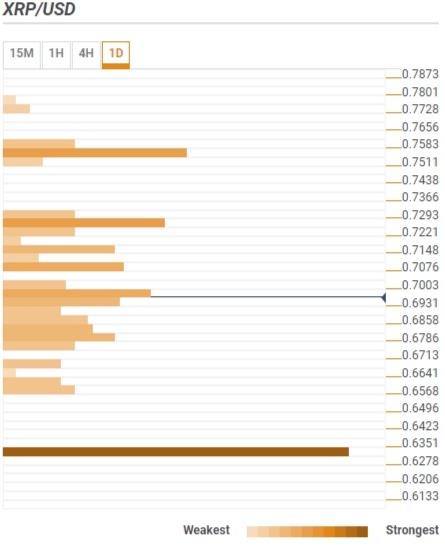
Ripple is trading inside a slight congestion area that adds difficulty to its movements to both sides. If XRP/USD continues to the upside, it will find a notable resistance at $0.72. A break above there would take the price to $0.755. On the other hand, if Ripple goes to the downside, there is a sequence of weak supports down to $0.65, with a very strong support at $0.63.
XRP/USD 1H chart
-636572241922239444.png)
MACD in the Ripple 1-hour chart has just crossed to the upside the 0 line, but still with a rather flat profile. This indicator is setting up for another rest in the current bullish move, probably before testing new rises later.
Directional Movement Index shows the buyers taking control while the sellers have not reacted. ADX is trading below the 20 level, the signal indicating the existance of trend strength and with a profile favorable to following a bearish trajectory.
Author

Tomas Salles
FXStreet
Tomàs Sallés was born in Barcelona in 1972, he is a certified technical analyst after having completing specialized courses in Spain and Switzerland.


