Bitcoin, Ethereum, and Ripple's breakout is imminent: Will symmetrical triangle patterns trigger a sell-off?

Symmetrical triangle patterns signal indecision—Will Bitcoin, Ethereum, and Ripple follow the Dow's lead?
Over the past seven weeks, Bitcoin (BTC) has formed a symmetrical triangle pattern with lower highs and higher lows, indicating a period of consolidation and indecision before a potential breakout. A similar pattern preceded the recent sell-off in the Dow Jones Industrial Average, raising concerns that Bitcoin and other cryptocurrencies might follow suit.
Adding to the downside risk, the recent $1.5 billion security breach of Bybit's Ethereum cold wallet has intensified selling pressure, creating further uncertainty in the crypto market. Meanwhile, institutional investors remain optimistic about the long-term prospects of Bitcoin, with ARK Invest's Cathie Wood reaffirming bullish projections.
Bitcoin (BTC): Triangle pattern nears resolution—Which direction will prevail?
Since Bitcoin's breakout at the $72,000 zone in November 2024, the trading range between $108,640 and $90,320 has tightened, with price action gravitating toward the midpoint. The next few days will be crucial as BTC/USD flirts with the $96,400 resistance level—an upside breakout could propel BTC toward the psychological $100,000 mark.
However, should sellers gain control and pierce the critical $90,320 support level, Bitcoin could be exposed to significant downside risks, with price targets at $87,200, $81,900, and $75,884. Bulls must defend $90,320 to keep upward momentum alive and push toward the $96,400 midpoint.
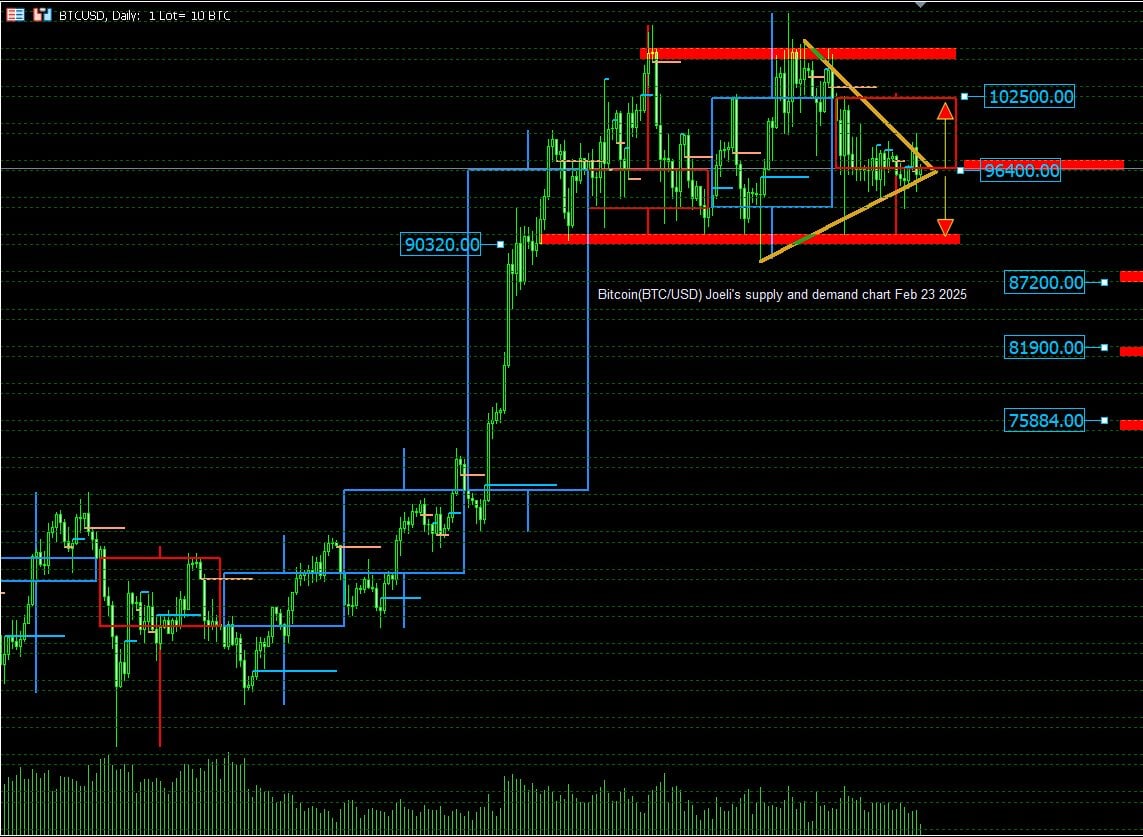
BTC/USD price chart February 23 2025
Ethereum (ETH): Long-term triangle formation approaches critical juncture
Ethereum's (ETH/USD) long-term price action mirrors Bitcoin's symmetrical triangle pattern, extending across weekly and monthly charts. The formation, which has been developing since November 2021, is nearing a pivotal point at $3,110, where a breakout could dictate future price movements.
ETH/USD has repeatedly failed to breach the top of the triangle, with the most recent rejection occurring in January 2025. After drifting downward for five weeks, Ethereum currently holds support at $2,610. Successful defence at this level could lead to a retest of $3,110 and potentially extend toward $3,638. Conversely, a failure to hold above $2,610 may open the door for a bearish move toward $2,027 and $1,492.
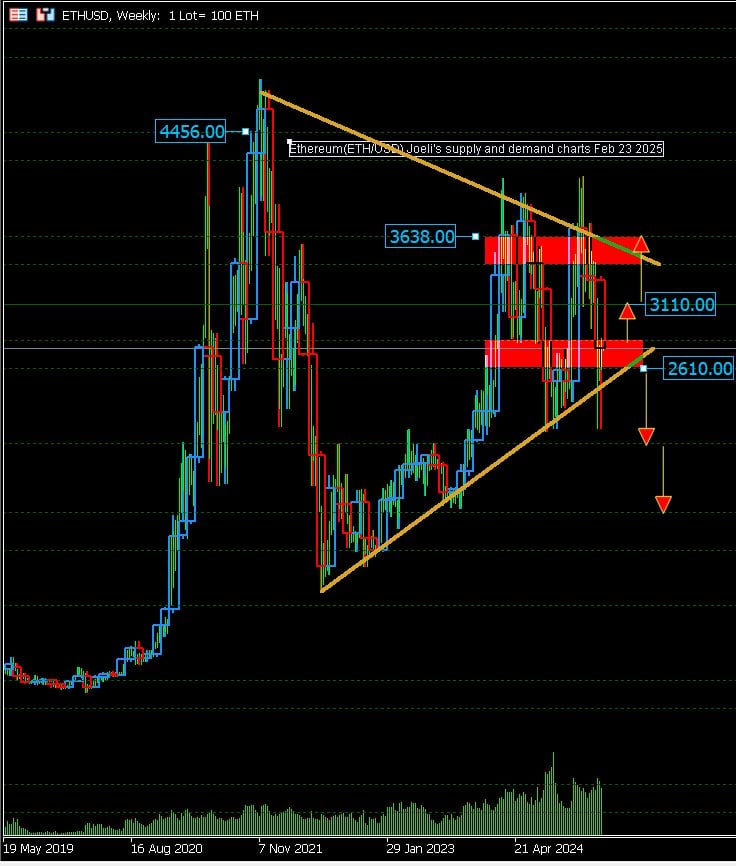
ETH/USD price chart February 23 2025
Ripple (XRP): Struggles below resistance—Is a breakdown imminent?
Ripple's (XRP/USD) price action also exhibits a well-defined symmetrical triangle pattern, reflecting the same uncertainty seen in Bitcoin, Ethereum, and the Dow Jones. The formation emerged in early January 2025, following a pullback to the $2.00 support level and a rally toward the $3.36 resistance zone.
Since mid-January, XRP has struggled to reclaim the triangle's upper boundary, facing repeated rejections. The price is now at a critical level around $2.60, where major market participants will decide its next move.
- A breakout above $2.60 could lead to tests of $2.85 and the January opening level near $3.10.
- A failure to hold $2.60 could result in a decline toward $2.35 and $2.00.
- A breach below the $2.00 mark could trigger a deeper sell-off, targeting $1.60.
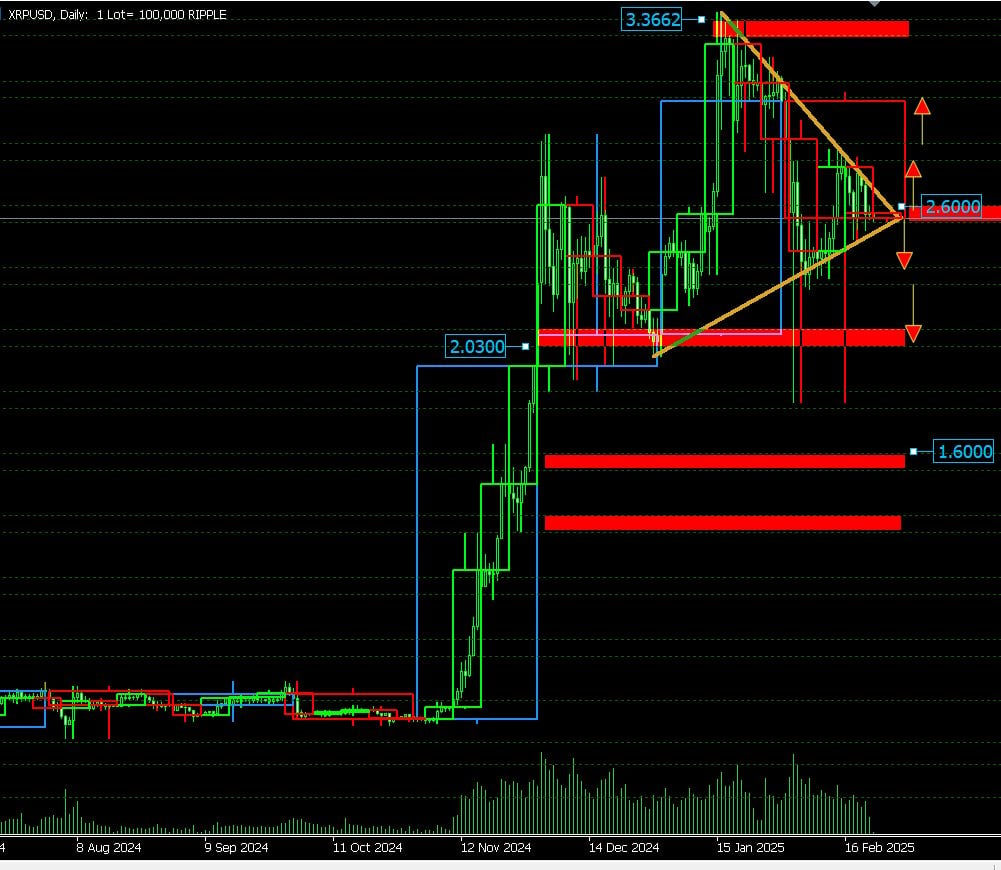
XRP/USD price chart February 23 2025
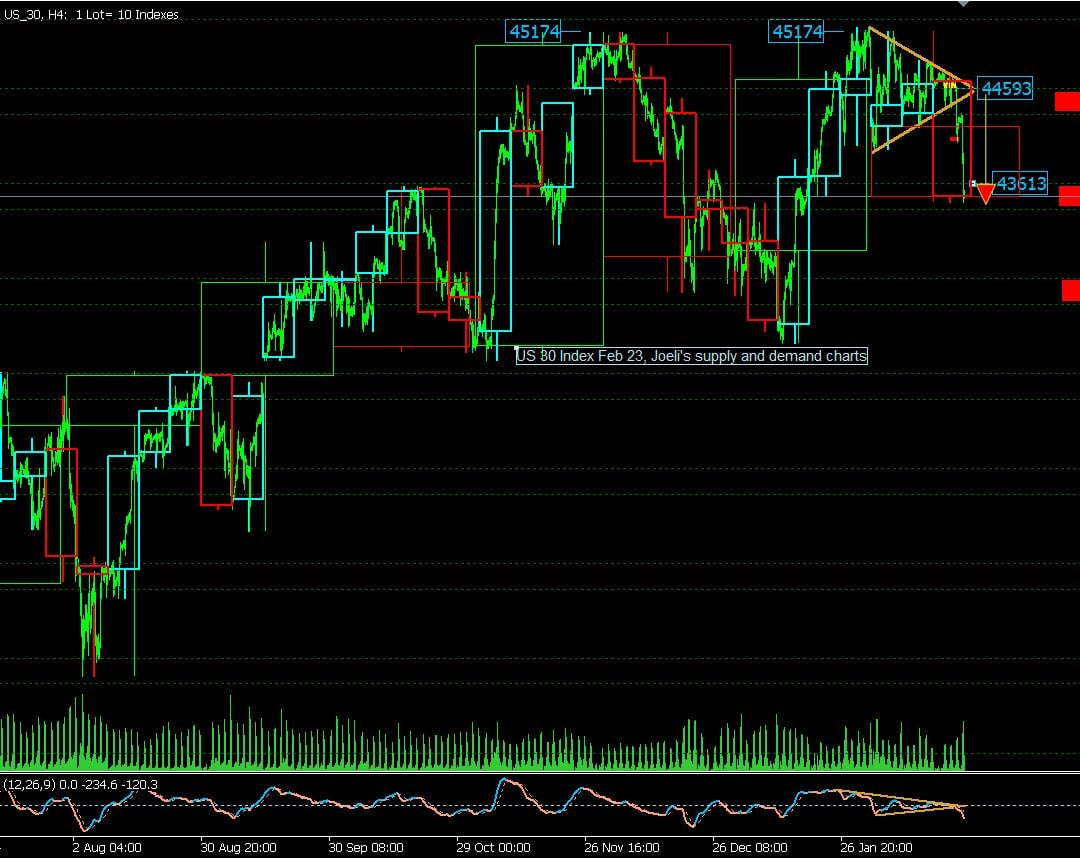
US 30 price chart February 23 2025
Conclusion: A make-or-break moment for cryptocurrencies
Bitcoin, Ethereum, and Ripple are at a crucial inflection point, with symmetrical triangle patterns indicating a major move ahead. The recent Dow Jones sell-off following a similar pattern raises concerns about a potential downside breakout for cryptocurrencies.
Additionally, the Bybit security breach has intensified short-term selling pressure, while institutional bullish sentiment remains intact. Traders should closely monitor key levels—Bitcoin's $90,320 support, Ethereum's $2,610 pivot, and Ripple's $2.60 threshold—as they will dictate the next market trend.
The coming days will reveal whether the crypto market follows the Dow's bearish trajectory or defies expectations with a bullish breakout.
Author

Denis Joeli Fatiaki
Independent Analyst
Denis Joeli Fatiaki possesses over a decade of extensive experience as a multi-asset trader and Market Strategist.


