Bitcoin, Ethereum and Ripple price prediction: Top 3 short-term analysis
- Negative short-term scenarios across the Crypto board
- Lost and remaining support levels focus the attention of traders

The Crypto sell-off continues in the main Cryptocurrencies, with meaningful short-term supports being broken. Today's resistances (yesterday's supports) have been tested in the early European session, but it doesn't look likely that the lost levels will be recovered.
BTC/USD 4H chart
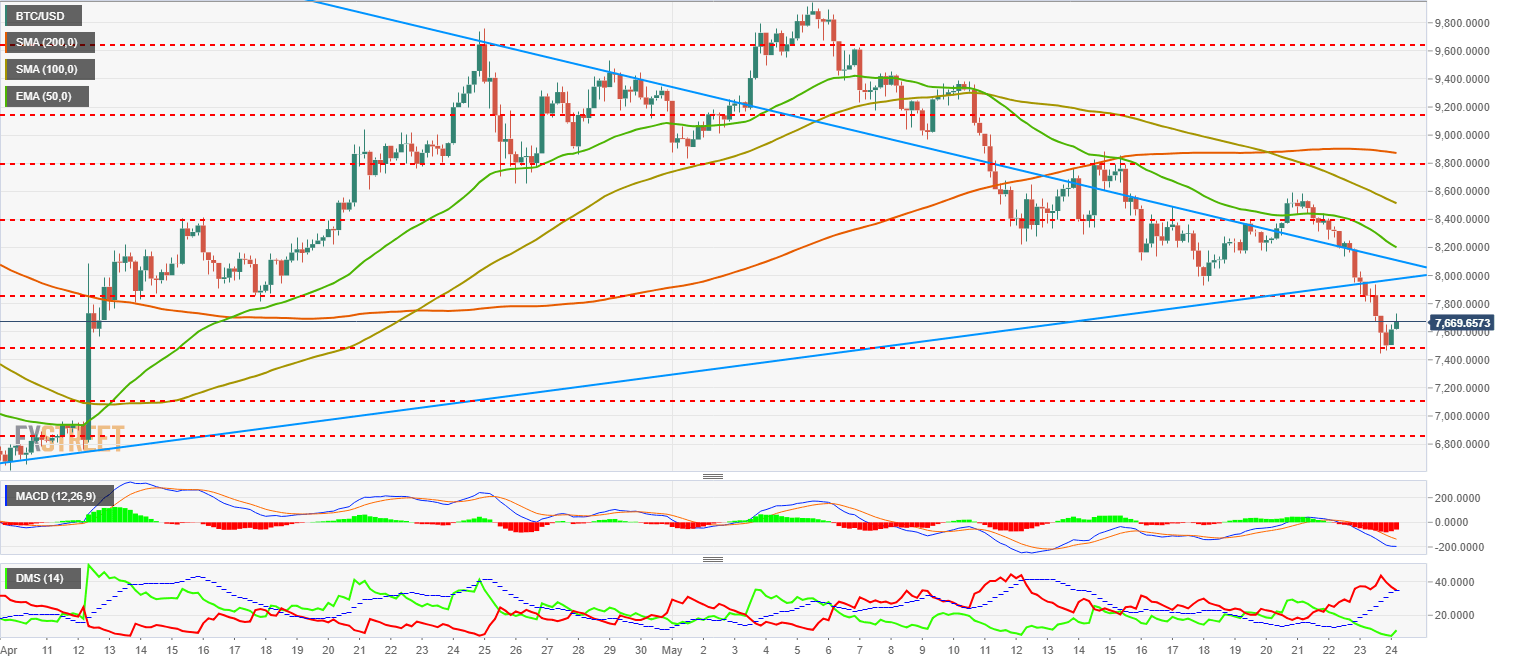
BTC/USD reached yesterday during the American session the support located at the $7500 mark, with a low located at $7442. This is the key level to watch right now, as falling just one pip below it would bring the Bitcoin price down to $7100. There is not any strong support at $7000, and a potential fall to $6850 looks more than likely.
On the upside, the scenario is complex, as any bullish attempts will meat two important trendlines, multiple price congestion resistances and every meaningful moving average. These are the all the key resistance levels: $7670, $7850, $7975, $8103, $8196, $8513 and finally at the 200-SMA the $8871 mark.
MACD in the Bitcoin 4-hour chart is still crossed to the downside, although with less inclination than yesterday. It still has enough room to cover before setting up for possible bullish attempts. The bulls might try a run in the intraday charts, and if they succeed, they would take Bitcoin back to the superior channel, improving a bit the technical outlook for the upcoming sessions.
Directional Movement Index in the same charts shows the sellers losing some strength and located below the ADX, the first indicator of a loss of strength. Buyers have reacted to the $7500 level with some interest, which might be positive for the price action.
ETH/USD 4H chart
-636627533837814459.png)
Ethereum is following a similar pattern than Bitcoin, although it still has not been able to recover the lost support at all. This is a textbook bearish breakout confirmation movement that now is heading down to $565, already reached during Asian trading. If that level is broken to the downside, free room to the $475-$500 area.
On the upside, there are fewer resistances than in the Bitcoin outlook we just saw. The key levels for the bulls to beat are $608, $620, $660, $667 and a very important resistance at the $700 level, where there is a confluence of an important price congestion level, the 100-SMA and the 200-SMA.
MACD in the Ethereum 4-hour chart is continuing its trajectory to the downside, although with less inclination than yesterday. It still has some room to the downside, so we need to consider as very likely a run down to lower supports.
Directional Movement Index in the same chart is showing the sellers losing some strength, while buyers are reacting with a small advance to the current levels. ADX is still at very high levels, with the loss of strength being quite likely for the upcoming periods.
XRP/USD 4H chart
-636627534414240611.png)
Ripple is touching the support at $0.58, just above the lows from last May 23rd at $0.5749. This is a complex area, with heavy-inclined triangle formation containing the XRP/USD right now. There are supports at $0.57, $0.55 and $0.50 as the main targets for bears.
On the upside, XRP/USD has several barriers containing the bulls. The first target is at $0.59, followed by $0.61, $0.63 and strong resistances at $0.66 and $0.70.
MACD in the Ripple 4-hour chart shows a very flat profile that might react to the upside before Bitcoin and Ethereum.
Directional Movement Index in the same chart is showing the sellers losing some strength and already clearly below the ADX. Here the patterns are more developed than in Bitcoin's charts. Buyers have already reacted to these price levels.
Author

Tomas Salles
FXStreet
Tomàs Sallés was born in Barcelona in 1972, he is a certified technical analyst after having completing specialized courses in Spain and Switzerland. He expanded his technical training following the guidance of great experts on the financial markets.


