Bitcoin Elliott Wave technical analysis [Video]
![Bitcoin Elliott Wave technical analysis [Video]](https://editorial.fxsstatic.com/images/i/BTC-neutral-object_XtraLarge.png)
BTC/USD Elliott Wave technical analysis
-
Function: Follow Trend.
-
Mode: Motive.
-
Structure: Impulse.
-
Position: Wave 3.
-
Invalidation level: 110,588.
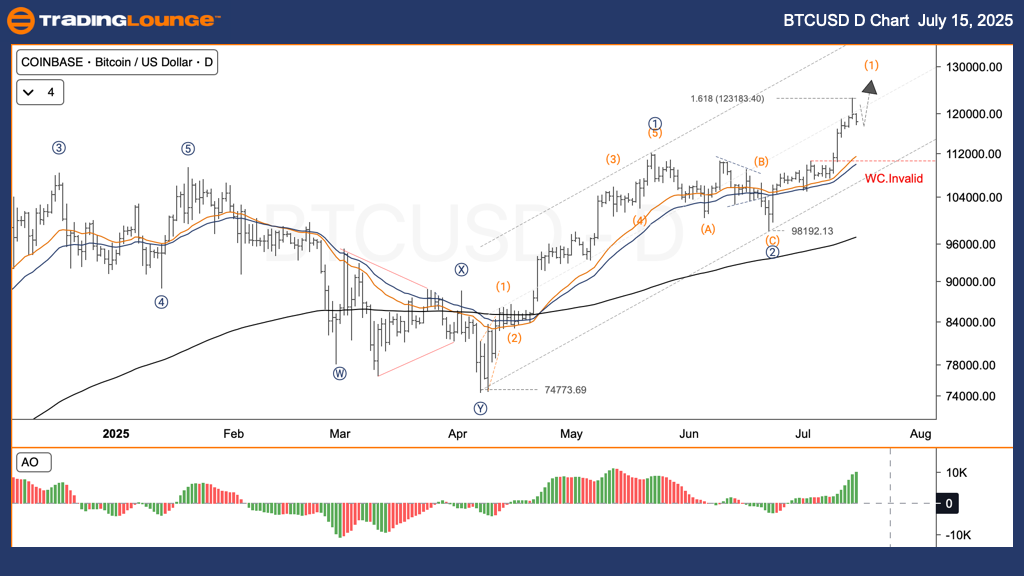
Market overview – Daily chart
Bitcoin (BTCUSD) is currently showing continued upward movement through an accelerating wave pattern. At present, price action is in a consolidation phase, specifically wave iv of sub-wave iii, acting as a short-term correction. Once this phase completes, we expect upward movement toward wave v of 3, followed by the final wave (5) in the larger degree trend structure (1).
Trading strategy
-
For short-term swing traders:
-
Wait for wave iv to consolidate near Fibonacci zones (0.236–0.382).
-
If a bullish reversal or a small impulse pattern is observed → Consider entering a long position to ride wave v.
-
-
Wave count invalidation:
-
If BTCUSD drops below 110,588, the current Elliott Wave structure will be considered invalid.
-
Bitcoin – Elliott Wave technical analysis and trading strategy
-
Function: Follow Trend.
-
Mode: Motive.
-
Structure: Impulse.
-
Position: Wave 3.
-
Invalidation level: 110,588.
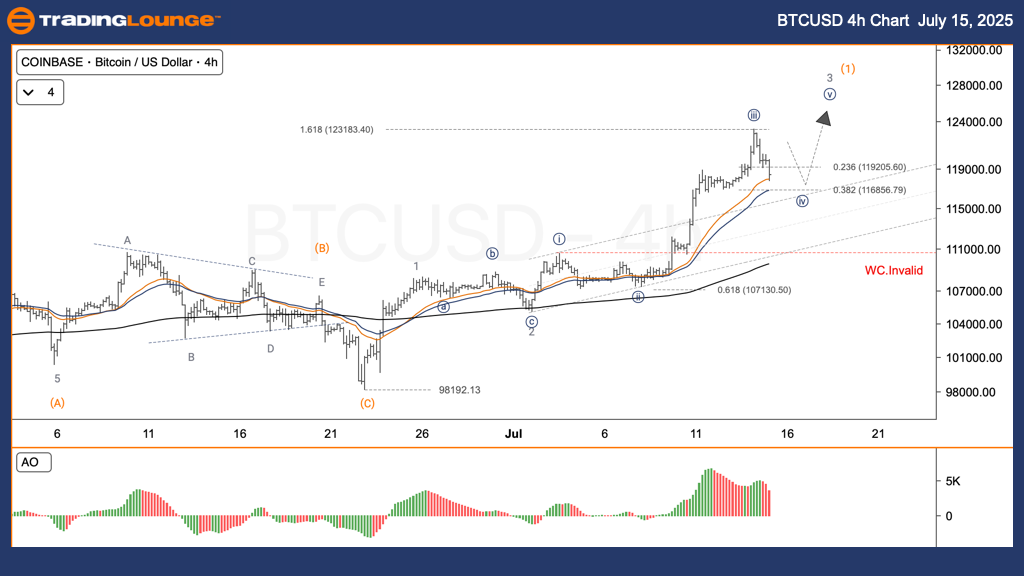
Market overview – Four-hour chart
BTCUSD shows the same structure on the 4-hour chart, confirming the consolidation phase of wave iv within sub-wave iii. This is a brief sideways move before Bitcoin resumes its upward path with wave v, continuing the impulse trend toward higher degrees.
Trading strategy
-
Short-term opportunity (swing trade):
-
Monitor consolidation zones near 0.236–0.382 Fibonacci levels.
-
Upon detecting a bullish reversal or minor impulse → go long to capture wave v.
-
-
Invalidation risk:
-
A decline under 110,588 will invalidate the current wave structure, signaling a change in the trend.
-
Bitcoin Elliott Wave technical analysis [Video]
Author

Peter Mathers
TradingLounge
Peter Mathers started actively trading in 1982. He began his career at Hoei and Shoin, a Japanese futures trading company.


