Bitcoin Elliott Wave technical analysis [Video]
![Bitcoin Elliott Wave technical analysis [Video]](https://editorial.fxsstatic.com/images/i/BTC-bearish-animal.png)
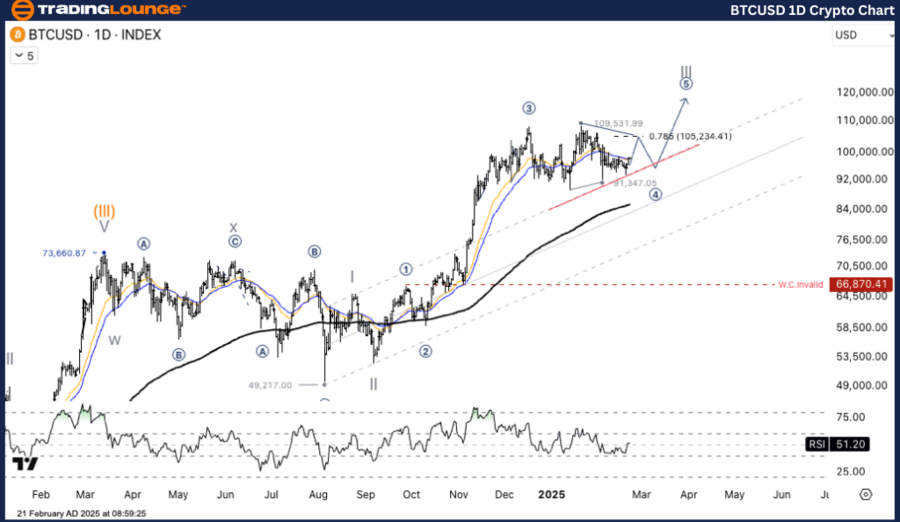
Elliott Wave Analysis TradingLounge Daily Chart.
Bitcoin/U.S. Dollar (BTCUSD).
BTC/USD Elliott Wave technical analysis
-
Function: Counter-Trend.
-
Mode: Corrective.
-
Structure: Flat.
-
Position: Wave (C).
-
Next higher degree direction: Wave ((4)).
-
Invalidation level:
Bitcoin/U.S. Dollar (BTCUSD) Trading Strategy:
BTC/USD is approaching the final phase of its Wave C correction, with key support positioned at $86,439.58. If the price rebounds and surpasses $97,198.26, it could indicate a bullish reversal. Conversely, a breakdown below $86,439.58 could signal a continuation of the downward trend.
Trading strategies:
-
Strategy:
-
Long Strategy:
-
Wait for a Buy Dip:
-
• If BTC holds above the $86,439.58 support level and shows a reversal signal, it may present a buying opportunity.
-
• The initial target is $97,198.26; if surpassed, BTC may advance towards higher resistance levels.
-
-
-
-
Risk Management:
-
If BTC/USD breaks below $86,439.58, it could extend losses toward deeper support levels in the $83,000 - $81,000 range.
-
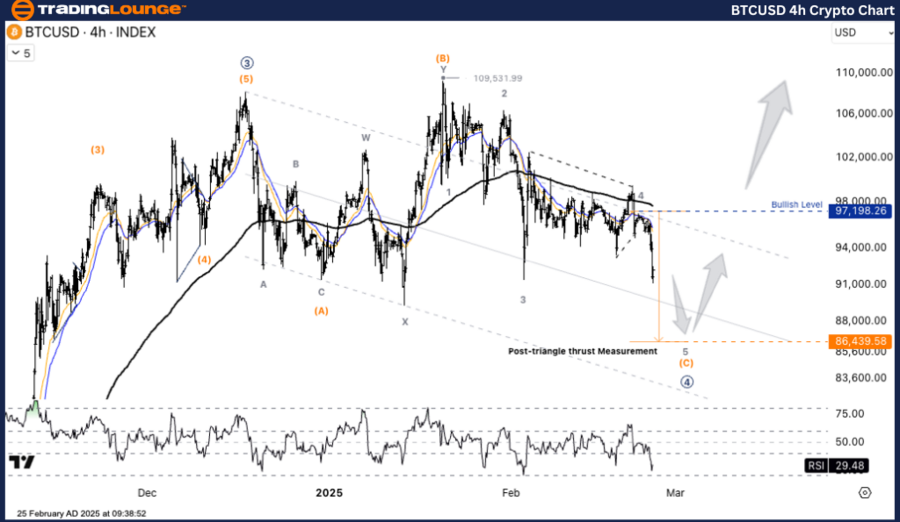
Elliott Wave Analysis TradingLounge H4 Chart.
Bitcoin/U.S. Dollar (BTCUSD).
BTC/USD Elliott Wave technical analysis
-
Function: Counter-Trend.
-
Mode: Corrective.
-
Structure: Flat.
-
Position: Wave (C).
-
Next higher degree direction: Wave ((4)).
-
Invalidation level:
Bitcoin/U.S. Dollar (BTCUSD) Trading Strategy:
BTC/USD is nearing the completion of its Wave C correction, with strong support at $86,439.58. If the price bounces and clears $97,198.26, a bullish reversal may follow. However, if BTC falls below $86,439.58, it could indicate further downside movement.
Trading strategies:
-
Strategy:
-
Long Strategy:
-
Wait for a Buy Dip:
-
• If BTC stays above the $86,439.58 support level and provides a reversal signal, it may be a good entry point.
-
• The first target is $97,198.26; a breakout beyond this level could push BTC toward higher resistance zones.
-
-
-
-
Risk Management:
-
If BTC/USD declines below $86,439.58, it may continue falling to deeper support areas between $83,000 - $81,000.
-
TradingLounge analyst: Kittiampon Somboonsod, CEWA.
BTC/USD Elliott Wave technical analysis [Video]
Author

Peter Mathers
TradingLounge
Peter Mathers started actively trading in 1982. He began his career at Hoei and Shoin, a Japanese futures trading company.


