Bitcoin Could Be Coiling Its Way Towards A Breakout

Bitcoin prices are coiling within a tight range after seeing relatively high levels of volatility last week, suggesting it could be preparing to another volatile burst.
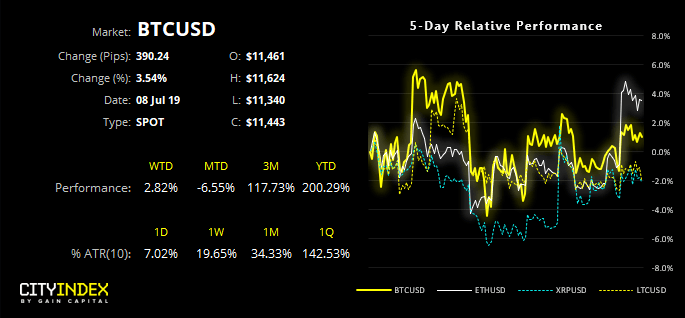
We’ve paid close attention to the level of volatility on Bitcoin recently, as leading into Independence Day BTC had hit levels of volatility usually associated with bearish trends, nasty corrections or periods leading up to a crash. However, volatility has subsided and it continues to hold above key levels of support, so we’re keen to see if it will now revert to its bullish trend.
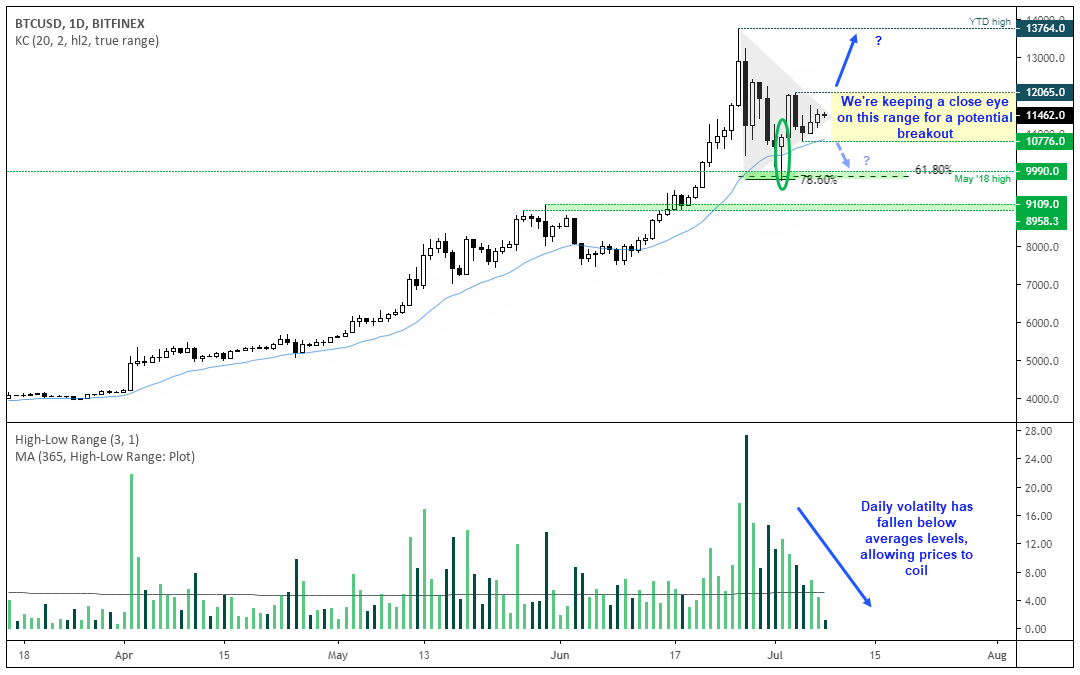
We can see on the daily chart that a bullish hammer tested a Fibonacci cluster just below 10k, and prices are trying to build a new level of support above 10,776. It remains touch and go as to whether it will correct lower once more before completing its retracement, so we’re keeping a close eye on 10,776 and 12,065 zone, as a breakout of either level could pave the way for its next directional move.
But the key point here is that the lower volatility is allowing prices to coil below 12k and, as compression precedes volatility spikes, we could be approaching a breakout (one way or the other).
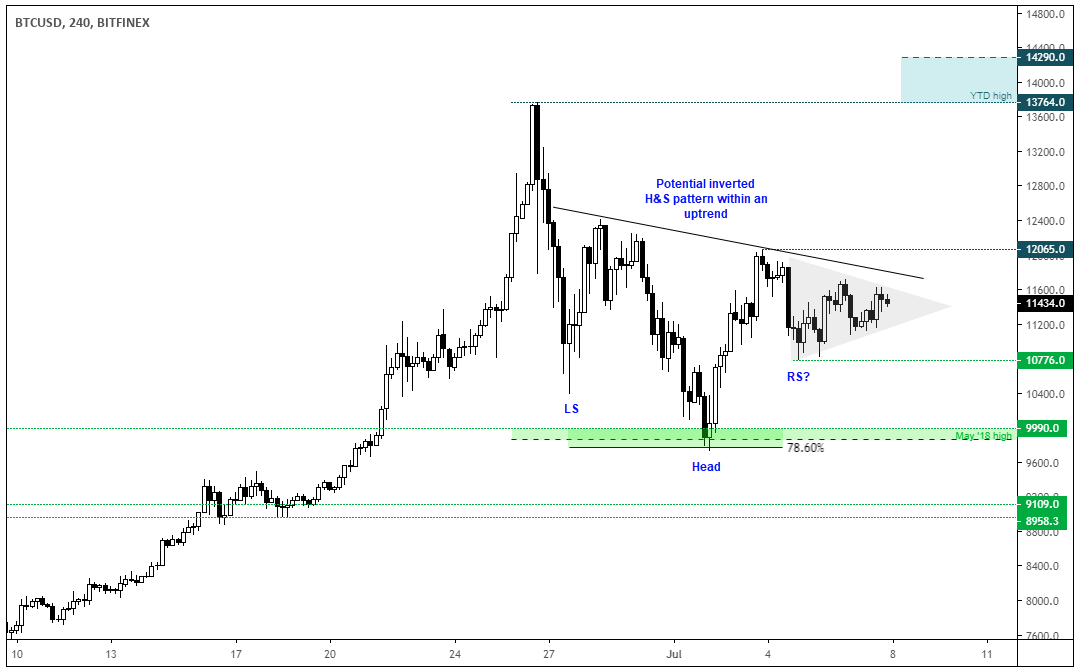
Switching to the four-hour chart, a triangle can be seen developing between the 10,776 – 12,065 zone. Furthermore, this could be part of a ‘right shoulder’ of an inverted head and shoulders pattern. Whilst these are typically seen at the end of downtrends, they can also be used as continuation patterns within an uptrend.
- If successful, the pattern projects a target around 14,290 (just above the highs) if we project the move from the sloping neckline.
- However, to enter long we’d want to see a break above 12,065
- A break below 10,776 suggests a deeper correction could be playing out, bringing $10k and $9.1k onto focus as bearish targets.
Author

Matt Simpson, CFTe, MSTA
CityIndex
Matt Simpson is a certified technical analyst who combines charts and fundamentals to generate trading themes.


