Bitcoin Coin Technical Analysis: BCH/USD bears take a deep breath after the heavy extended move south from the triangular pattern
- Bitcoin Cash was seen nursing losses of over 1.5% on Wednesday, with further price softening still being seen across the board.
- BCH/USD received some relief around the 21st July low and demand area, after the extended break south from triangular pattern.

BCH/USD 60-minute chart
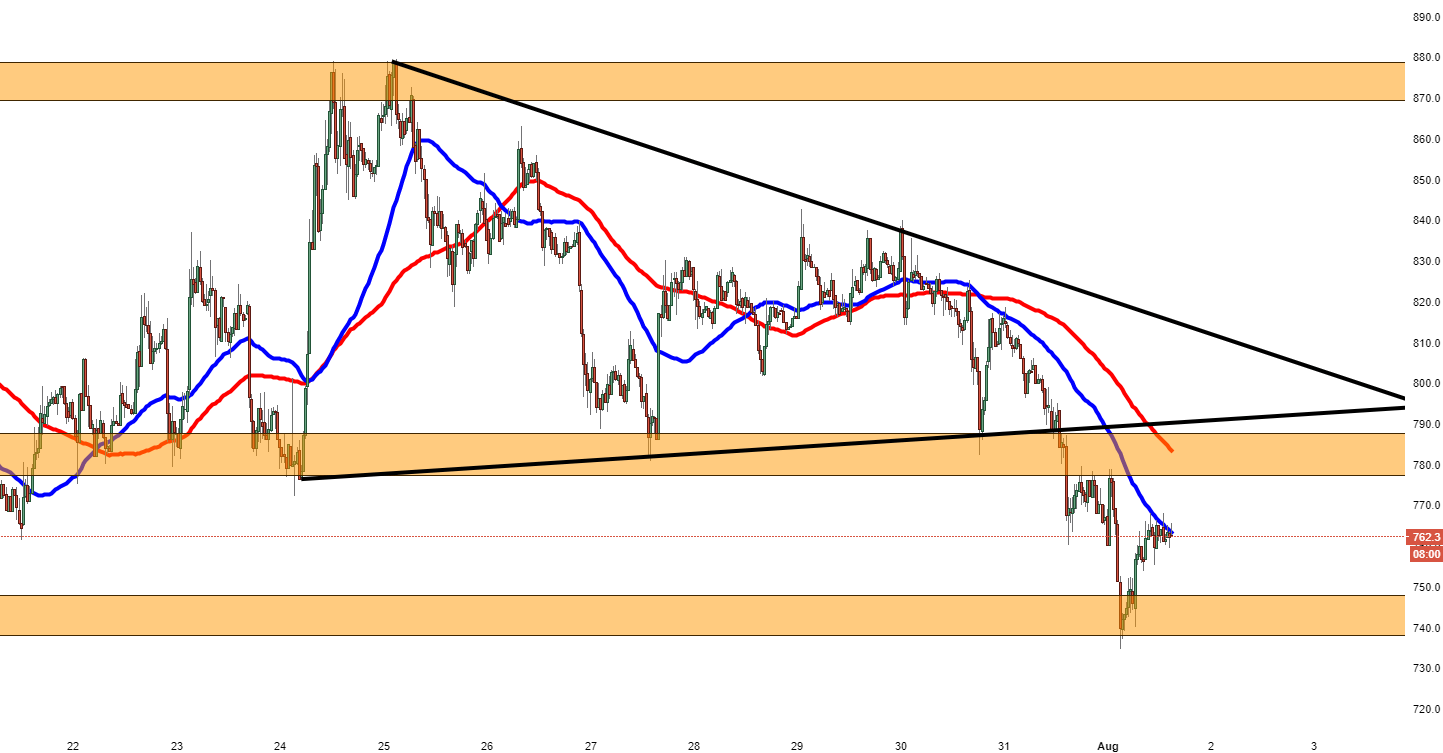
Spot rate: 764.6
Relative change: -1.60%
High: 778.6
Low: 734.4
Trend: Bearish
Support 1: 762.5, 50MA.
Support 2: 755-60, consolidation area.
Support 3: 740.1, strong demand zone and 21st July low.
Resistance 1: 778.0, (resistance on 60-minute chart).
Resistance 2: 780.5, supply zone.
Resistance 3: 783.3, 100MA.
Author

Ken Chigbo
Independent Analyst
Ken has over 8 years exposure to the financial markets. He started his career as an analyst, covering a variety of asset classes; forex, fixed income, commodities and equities.
More from Ken Chigbo


