Bitcoin Chart Analysis: Symmetrical triangle breakout to power BTC/USD above $9700


  • Bitcoin rebounds on Saturday following early dip.
  • The No.1 coin displays a bullish technical set up.
  • BTC bulls eye 9700 so long above 21-bar SMA.

Bitcoin (BTC/USD) is struggling hard to recover ground after the early drop to 9529.71 lows, tracing the broader sentiment across the crypto markets. The bulls are finding some stiff resistance around the 9630 mark on the road to recovery. Although the path of least resistance appears to the upside in the near-term amid a favorable bullish technical set up. At the press time, no. 1 coin trades flat around 9615, set to end the week 1.5% higher. It enjoys a market capitalization of $177.17 billion so far this Saturday.

Technical Overview

BTC/USD 15-minutes chart

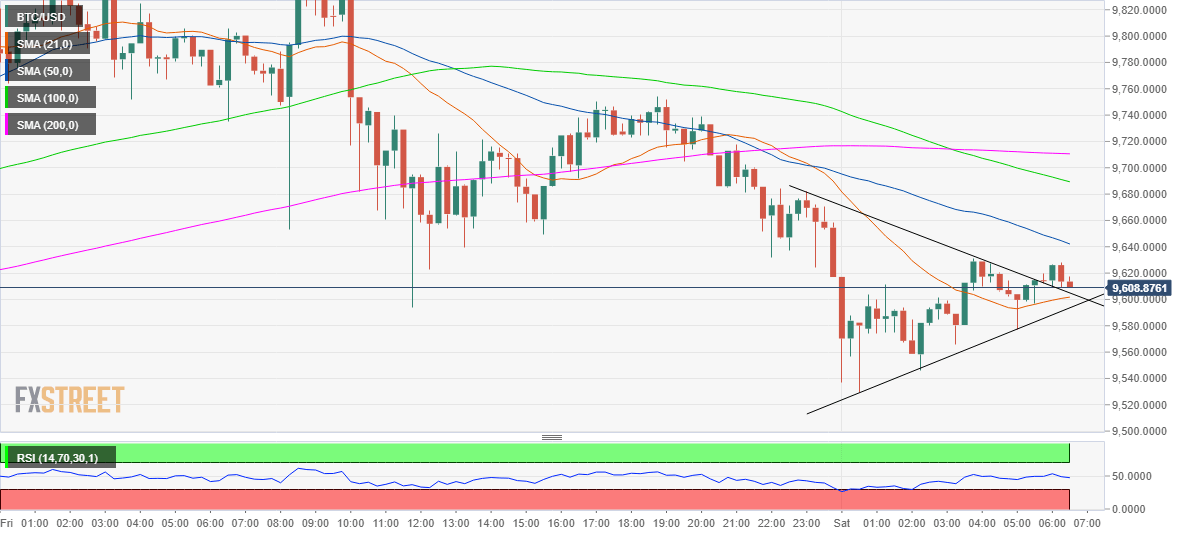
On the 15-minutes chart, the price has charted a symmetrical triangle breakout in the last hour, opening doors for a test of the pattern target at 9746. Despite the bullish breakout, its likely to remain an uphill task for the bulls to achieve the target, given a bunch of healthy resistance levels placed ahead of that level.  

The immediate resistance awaits at the downward sloping 50-bar Simple Moving Average (SMA) at 9642, above which the next one is aligned at 9689.40 (bearish 100-bar SMA). Further up, the horizontal 200-bar SMA at 9711 could emerge as a tough nut to crack for the buyers.

Alternatively, any pullback is likely to meet fresh demand around 9600 levels, the confluence of the previous trendline resistance now turned support and bullish 21-bar SMA.

To conclude, the price may extend the range trade following the bullish break. The bullish bias remains intact so long as the No. 1 coin holds above the 21-bar SMA.

BTC/USD technical levels to watch

BTC/USD

Overview
Today last price 9614.59
Today Daily Change -3.44
Today Daily Change % -0.04
Today daily open 9617.03
 
Trends
Daily SMA20 9436.48
Daily SMA50 8825.65
Daily SMA100 7916.24
Daily SMA200 8095.08
 
Levels
Previous Daily High 9855.52
Previous Daily Low 9594.11
Previous Weekly High 10404.88
Previous Weekly Low 9279.17
Previous Monthly High 10074.48
Previous Monthly Low 8105.58
Daily Fibonacci 38.2% 9693.97
Daily Fibonacci 61.8% 9755.66
Daily Pivot Point S1 9522.25
Daily Pivot Point S2 9427.48
Daily Pivot Point S3 9260.84
Daily Pivot Point R1 9783.66
Daily Pivot Point R2 9950.3
Daily Pivot Point R3 10045.07


Information on these pages contains forward-looking statements that involve risks and uncertainties. Markets and instruments profiled on this page are for informational purposes only and should not in any way come across as a recommendation to buy or sell in these assets. You should do your own thorough research before making any investment decisions. FXStreet does not in any way guarantee that this information is free from mistakes, errors, or material misstatements. It also does not guarantee that this information is of a timely nature. Investing in Open Markets involves a great deal of risk, including the loss of all or a portion of your investment, as well as emotional distress. All risks, losses and costs associated with investing, including total loss of principal, are your responsibility. The views and opinions expressed in this article are those of the authors and do not necessarily reflect the official policy or position of FXStreet nor its advertisers. The author will not be held responsible for information that is found at the end of links posted on this page.

If not otherwise explicitly mentioned in the body of the article, at the time of writing, the author has no position in any stock mentioned in this article and no business relationship with any company mentioned. The author has not received compensation for writing this article, other than from FXStreet.

FXStreet and the author do not provide personalized recommendations. The author makes no representations as to the accuracy, completeness, or suitability of this information. FXStreet and the author will not be liable for any errors, omissions or any losses, injuries or damages arising from this information and its display or use. Errors and omissions excepted.

The author and FXStreet are not registered investment advisors and nothing in this article is intended to be investment advice.

Join Telegram

Recommended content


Recommended Content

Editors’ Picks

Ethereum dips slightly amid Renzo depeg, BlackRock spot ETH ETF amendment

Ethereum dips slightly amid Renzo depeg, BlackRock spot ETH ETF amendment

Ethereum (ETH) suffered a brief decline on Wednesday afternoon despite increased accumulation from whales. This follows Ethereum restaking protocol Renzo restaked ETH (ezETH) crashing from its 1:1 peg with ETH and increased activities surrounding spot Ethereum ETFs.

More Ethereum News

Injective price weakness persists despite over 5.9 million INJ tokens burned

Injective price weakness persists despite over 5.9 million INJ tokens burned

Injective (INJ) price is trading with a bearish bias, stuck in the lower section of the market range. The bearish outlook abounds despite the network's deflationary efforts to pump the price. Coupled with broader market gloom, INJ token’s doomed days may not be over yet.

More Injective News

US intensifies battle against crypto privacy protocols following crackdown on Samourai Wallet

US intensifies battle against crypto privacy protocols following crackdown on Samourai Wallet

CEO Keonne Rodriguez and CTO William Lonergan of Samourai Wallet were arrested by the US Department of Justice (DoJ) on Wednesday and charged with $100 million in money laundering on a count and illegal money transmitting on another count. This move could see privacy-focused cryptocurrencies take a dip.

More Cryptocurrencies News

Near Protocol Price Prediction: NEAR fulfills targets but a 10% correction may be on the horizon

Near Protocol Price Prediction: NEAR fulfills targets but a 10% correction may be on the horizon

Near Protocol price has completed a 55% mean reversal from the bottom of the market range at $4.27. Amid growing bearish activity, NEAR could drop 10% to the $6.00 psychological level before a potential recovery. A break and close above $7.95 would invalidate the downleg thesis.

More Near Protocol News

Bitcoin: BTC post-halving rally could be partially priced in Premium

Bitcoin: BTC post-halving rally could be partially priced in

Bitcoin (BTC) price briefly slipped below the $60,000 level for the last three days, attracting buyers in this area as the fourth BTC halving is due in a few hours. Is the halving priced in for Bitcoin? Or will the pioneer crypto note more gains in the coming days? 

Read full analysis

BTC

ETH

XRP