Bitcoin chart analysis after tesla buys $1.5 billion and reaches $50k
-
Bitcoin (BTC/USD) has made yet another massive bullish breakout. Tesla announced its purchase of $1.5 billion worth of Bitcoin.
-
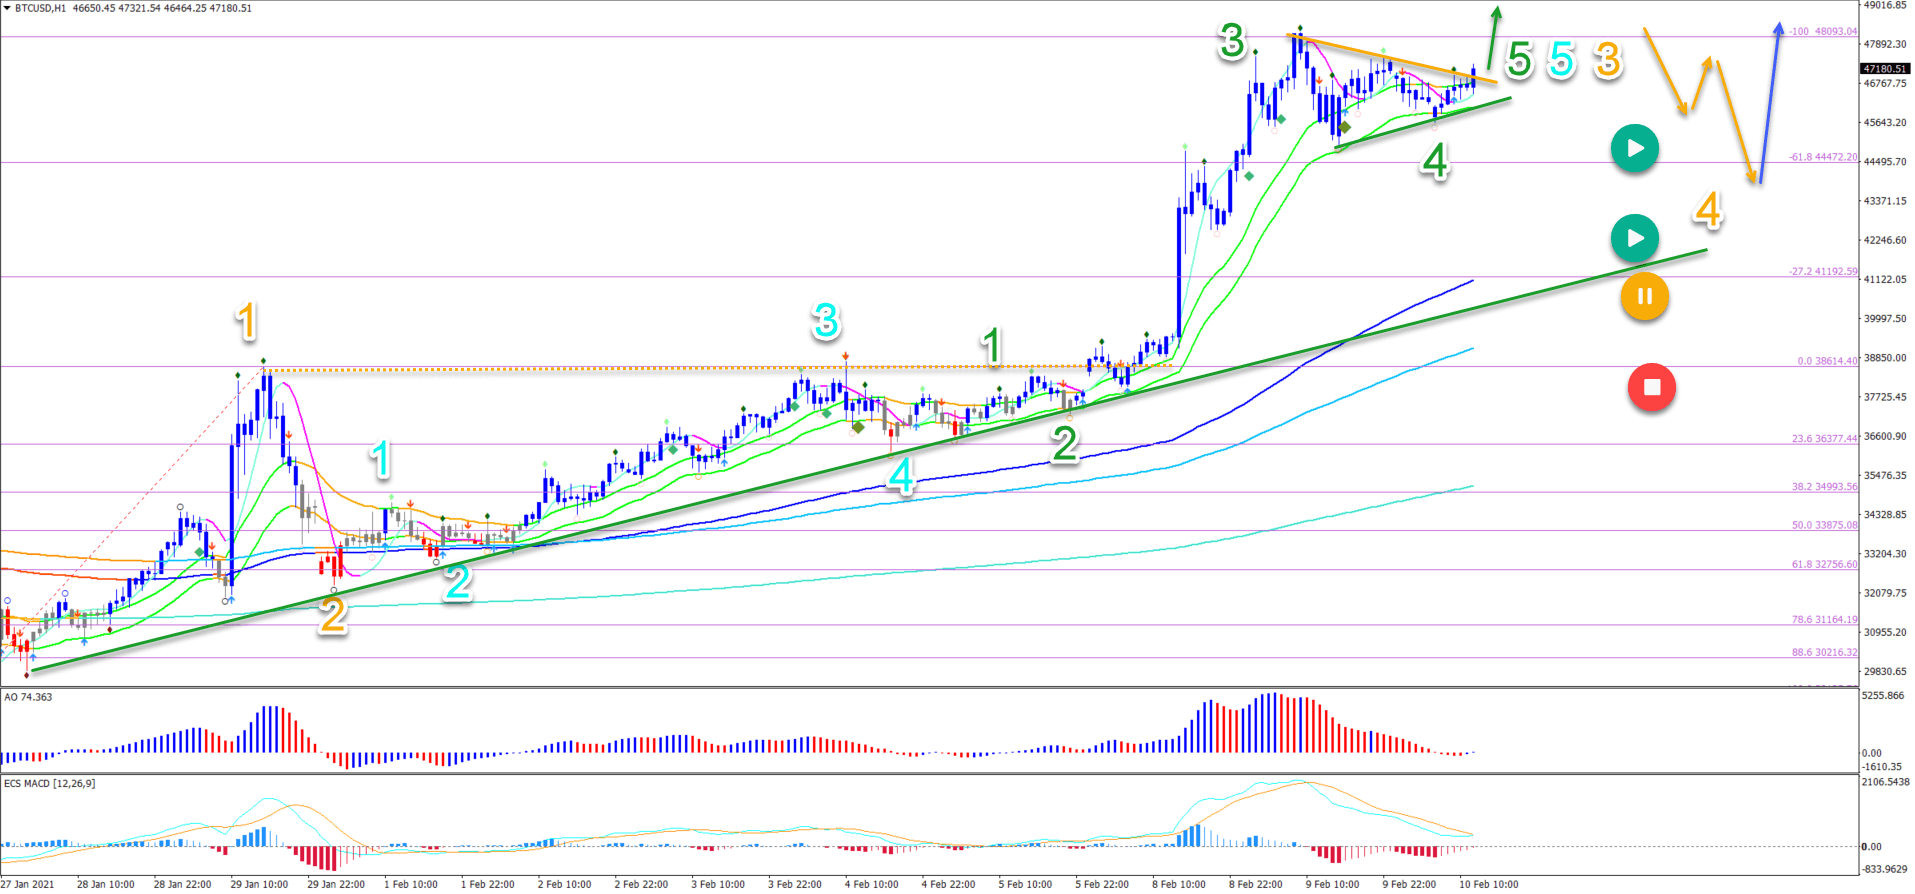
On the 1 hour chart, we can see that the impulsive push higher is probably a wave 3 (green) of wave 3 (orange). This means that the current pullback is a wave 4
-
A retracement is expected to take place (orange arrows) in wave 4 (orange) back to the support zone around $43-45k. The main targets after the $50k are $55k and $61k.

The bullish breakout delivered on the trading idea from last trading week. Let’s now discuss what to expect this and next week.
Price Charts and Technical Analysis
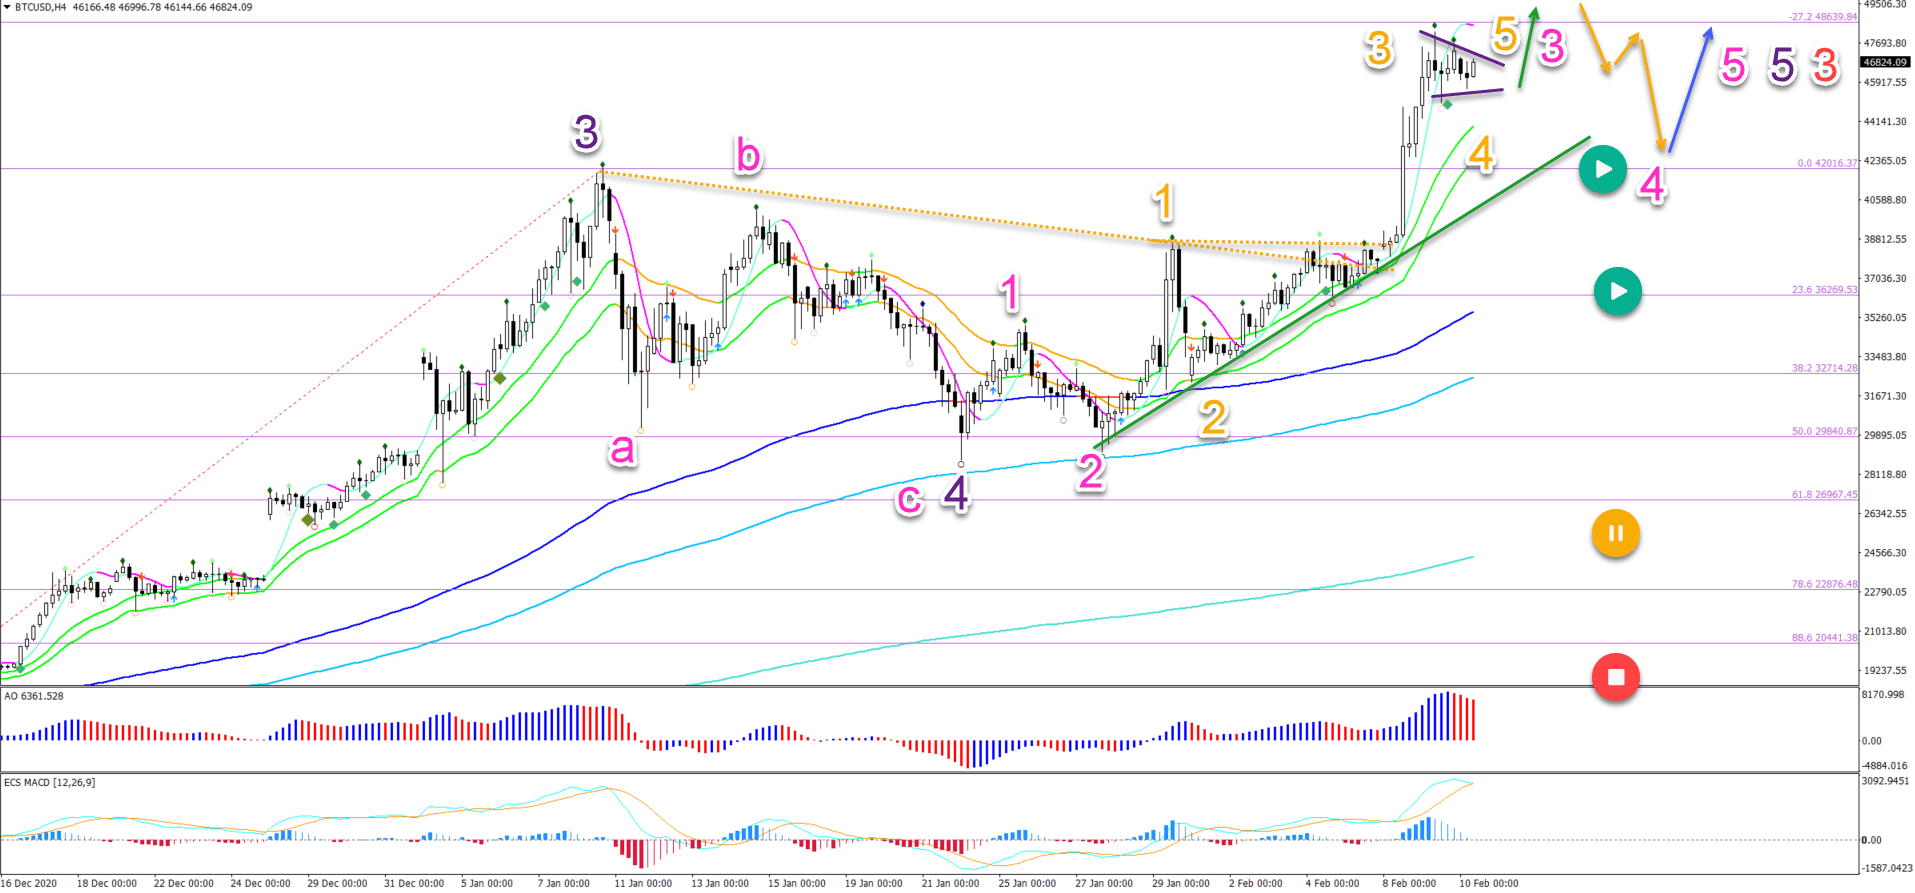
The BTC/USD bullish breakout confirmed the uptrend continuation. The deeper pullbacks from last week indicate a wave 1-2 (pink/orange) pattern. The current strong push up is likely an impulsive wave 3 (orange).
But the main target for the short-term is $50,000 psychological round level. Although price action could easily break (green arrow) the smaller triangle pattern (purple lines), there is not much space before hitting that target.
A retracement is expected (orange arrows) after hitting the target. Then a bullish bounce should resume the uptrend again (blue arrow).
On the 1 hour chart, we can see that the impulsive push higher is probably a wave 3 (green) of wave 3 (orange). This means that the current pullback is a wave 4 (green) and the future breakout a wave 5 (green).
After that, a retracement is expected to take place (orange arrows) in wave 4 (orange) back to the support zone around $43-45k. The main targets after the $50k are $55k and $61k.
The analysis has been done with the ecs.SWAT method and ebook.
Author

Chris Svorcik
FS method
Chris Svorcik is a trader, analyst, and educator with over 15 years of experience in financial markets, specializing in moving averages, market structure, and price patterns.


