Bitcoin Cash technical analysis: BCH/USD subject to a potential explosive breakout
- Bitcoin Cash price is trading in the green, with gains of 0.35% in the second half of the session.
- BCH/USD the price behaviour and technical structure suggest further moves south.
- The price has done little since 23 November, a lack of committed direction.

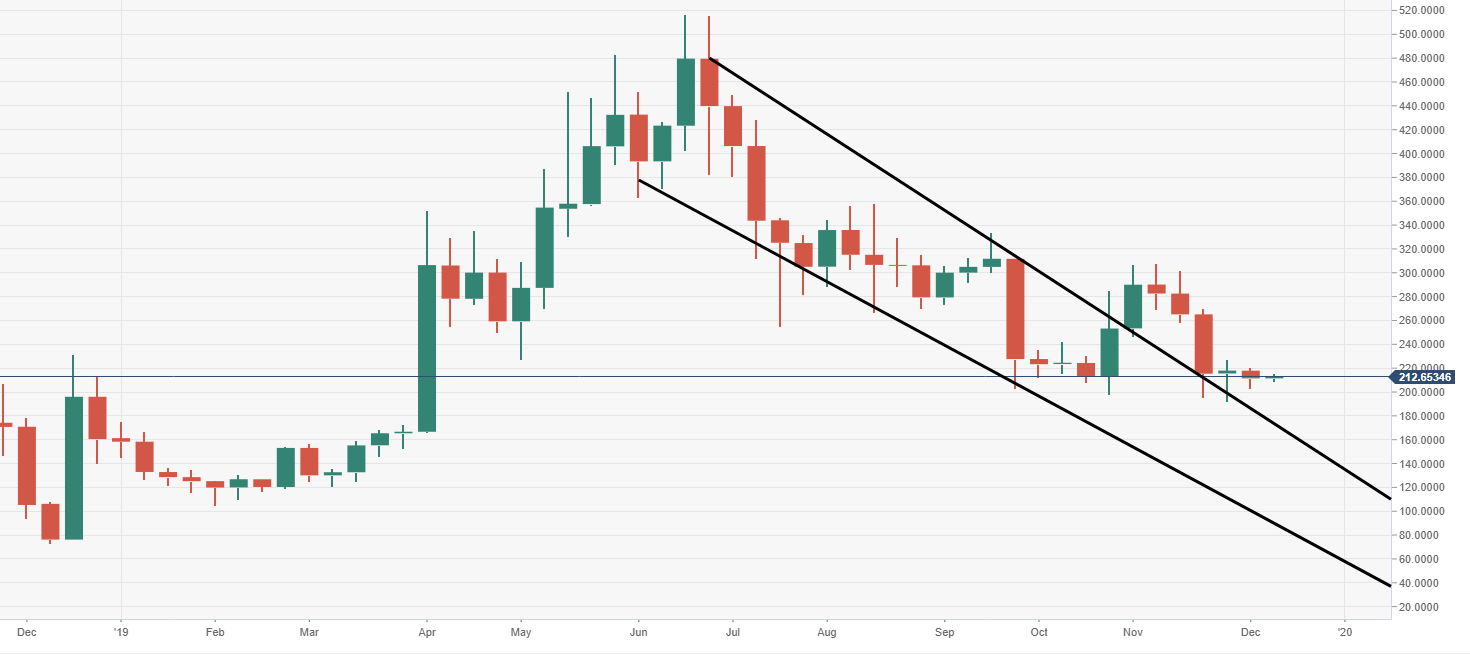
BCH/USD weekly chart
Price action via the weekly is trading just above a breached flag structure, moving within consolidation mode.
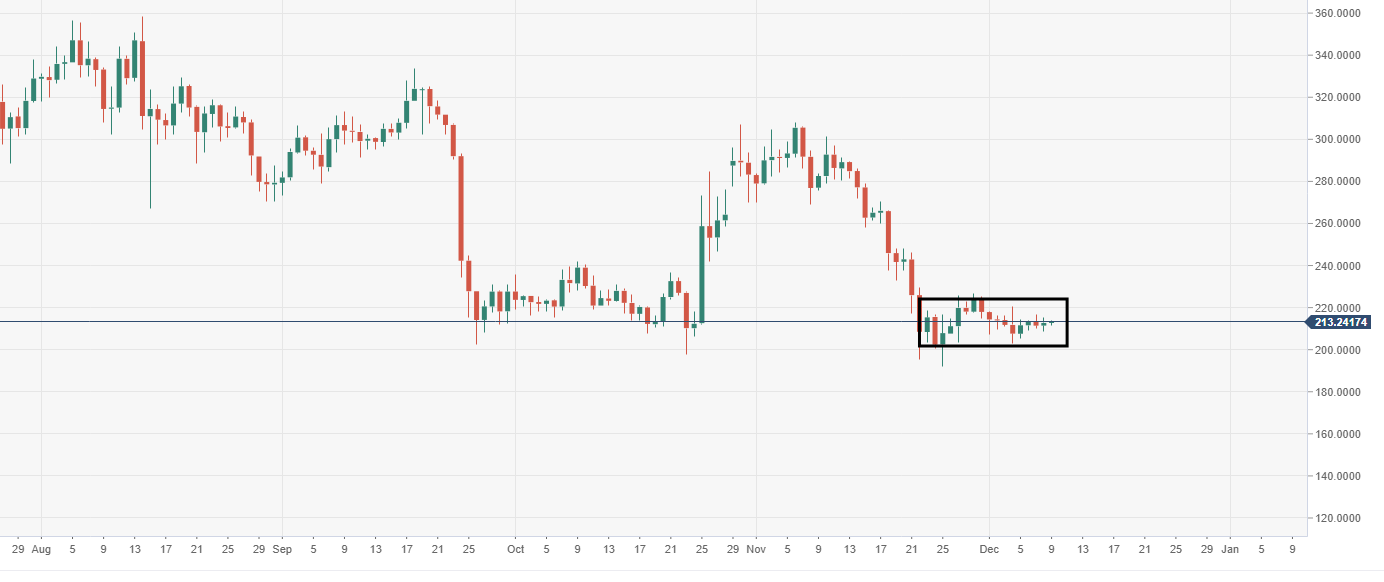
BCH/USD daily chart
The price within the daily view is narrowing, a range to the low of $200 to the high up at $225.
Spot rate: 211.49
Relative change: +0.30 %
High: 213.97
Low: 211.70
Author

Ken Chigbo
Independent Analyst
Ken has over 8 years exposure to the financial markets. He started his career as an analyst, covering a variety of asset classes; forex, fixed income, commodities and equities.
More from Ken Chigbo


