|

Bitcoin Cash technical analysis: BCH/USD remains above $400

BCH/USD daily chart

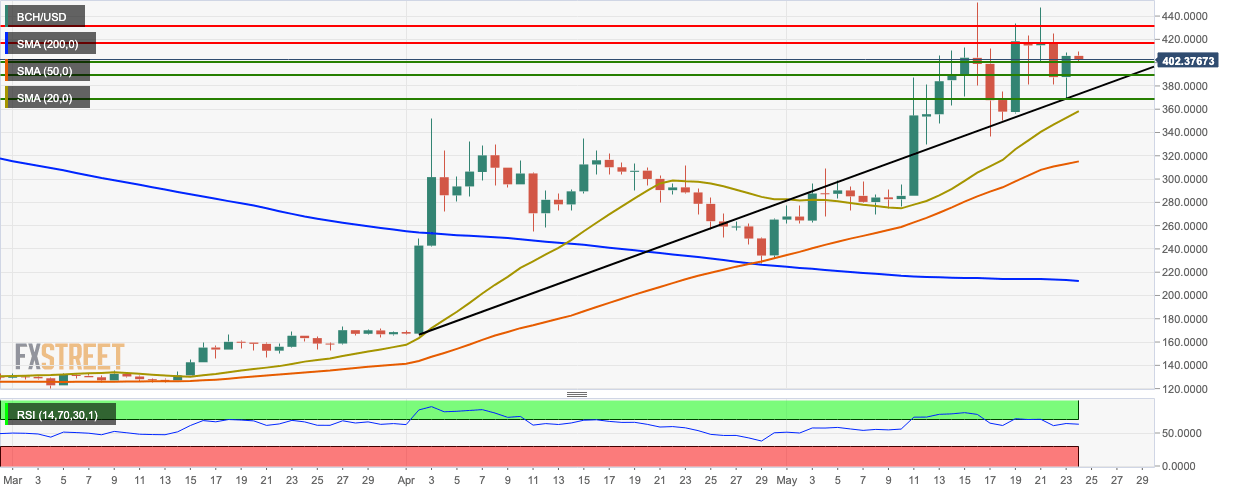
  • BCH/USD went down from $406.30 to $402.50 in the early hours of Friday.
  • Critical support line lies at $400, which the bulls must defend at all costs.
  • The market remains above the 2000-day simple moving average (SMA 200), SMA 50 and SMA 20 curves.
  • The relative strength index (RSI) indicator is trending at 65.60.

BCH/USD 4-hour chart

  • The five latest sessions in the 4-hour price chart have taken the price from below the 20-day Bollinger band to the middle.
  • The 4-hour market finds resistance at the SMA 20 curve. 
  • The market is trending above the SMA 50 and SMA 200 curves.
  • The moving average convergence divergence (MACD) indicator shows decreasing bearish momentum as the signal line converges with the MACD line.

BCH/USD hourly chart

  • The hourly market found resistance $407.75
  • The Ichimoku indicator hints that upcoming market sentiment may be bullish.
  • The bulls need to garner enough momentum to breach the critical $407.75 resistance level.
  • Six out of the seven latest sessions in the Elliot oscillator is bullish.

Key levels

BCH/USD

Overview
Today last price401.684
Today Daily Change-4.0981
Today Daily Change %-1.01
Today daily open405.7821
 
Trends
Daily SMA20347.7614
Daily SMA50311.2013
Daily SMA100227.4641
Daily SMA200216.7646
Levels
Previous Daily High408.6708
Previous Daily Low368.1427
Previous Weekly High452.0904
Previous Weekly Low330
Previous Monthly High352.3611
Previous Monthly Low166.4624
Daily Fibonacci 38.2%393.1891
Daily Fibonacci 61.8%383.6244
Daily Pivot Point S1379.7263
Daily Pivot Point S2353.6705
Daily Pivot Point S3339.1982
Daily Pivot Point R1420.2543
Daily Pivot Point R2434.7266
Daily Pivot Point R3460.7824

Author

Rajarshi Mitra

Rajarshi Mitra

Independent Analyst

Rajarshi entered the blockchain space in 2016. He is a blockchain researcher who has worked for Blockgeeks and has done research work for several ICOs. He gets regularly invited to give talks on the blockchain technology and cryptocurrencies.

More from Rajarshi Mitra
Share:

Editor's Picks

Ripple Price Forecast: XRP potential bottom could be in sight

Ripple edges up above the intraday low of $1.35 at the time of writing on Friday amid mixed price actions across the crypto market. The remittance token failed to hold support at $1.40 the previous day, reflecting risk-off sentiment amid a decline in retail and institutional sentiment. 

Crypto Today: Bitcoin, Ethereum, XRP in choppy price action, weighed down by falling institutional interest 

Bitcoin holds above support at $65,118 at the time of writing on Friday. Ethereum remains choppy in a narrow range between support at $1,900 and resistance at $2,000, while Ripple attempts another upward move toward the pivotal $1.40 level.

PancakeSwap Price Analysis: Bearish momentum suggests further downside

PancakeSwap (CAKE) is trading below $1.26 at the time of writing on Friday, extending the losses by over 8% so far this week. The weakening derivatives market further supports the bearish outlook, with bears aiming for levels below $1.18.

Decred Price Forecast: DCR rebounds toward key resistance zone on volume spike

Decred (DCR) rebounds over 7% at press time on Friday after a three-day decline of almost 14%. Roughly 60% increase in trading volume over the last 24 hours supports the recovery, suggesting heightened spot-market demand. 

Bitcoin Price Annual Forecast: BTC holds long-term bullish structure heading into 2026

Bitcoin (BTC) is wrapping up 2025 as one of its most eventful years, defined by unprecedented institutional participation, major regulatory developments, and extreme price volatility.

Bitcoin: BTC bears aren’t done yet

Bitcoin (BTC) price slips below $67,000 at the time of writing on Friday, remaining under pressure and extending losses of nearly 5% so far this week.