Bitcoin Cash Technical Analysis: BCH/USD price action is narrowing within a wedge, pending a breakout
- Bitcoin Cash seen down over 4% on Friday, as bearish momentum continues, after bulls failed to sustain upside from the beginning of the week.
- BCH/USD price action has formed a narrowing wedge, since the highs at the start of the week.

BCH/USD 60-minute chart
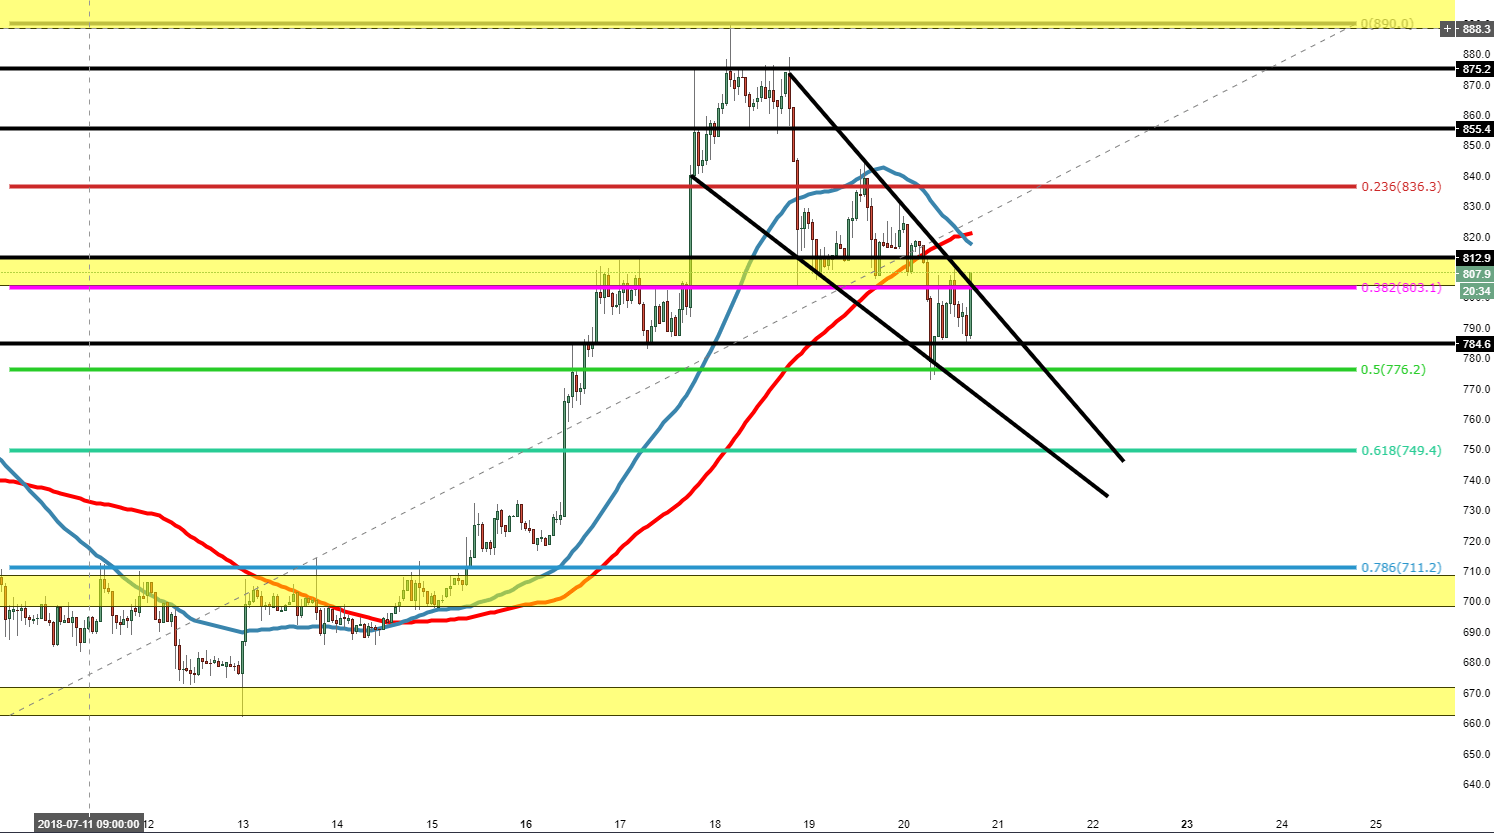
Spot rate: 792.0
Relative change: -4.00%
High: 823.9
Low: 772.6
Trend: Bearish
Support 1: 784.6, (support on 60-minute chart).
Support 2: 775.5, 50% Fibonacci.
Support 3: 764.6, lower part of wedge.
Resistance 1: 801.1, upper part of wedge.
Resistance 2: 802.8, 38.2% Fibonacci.
Resistance 3: 811.0, supply zone.
Author

Ken Chigbo
Independent Analyst
Ken has over 8 years exposure to the financial markets. He started his career as an analyst, covering a variety of asset classes; forex, fixed income, commodities and equities.
More from Ken Chigbo


