|

Bitcoin Cash Price Prediction: 100-DMA is the level to beat for the bulls

  • The No. 5 cryptocurrency stalls two-day recovery momentum.
  • BCH/USD - the main laggard among top 5 dominant cryptocurrencies.

Bitcoin Cash (BCH/USD) hit fresh seven-week highs in the overnight trades and since then has entered a phase of upside consolidation above the 222 handle. With the retracement, the price has stalled its two straight days of recovery, as the bulls catch a breath before the next leg higher.  The world’s fifth-most favorite digital asset, currently, trades close to the 224 level amid the weekend love prevalent across the crypto space. The coin posts small losses so far this Sunday, although it gains 0.50% over the last 24 hours. The market capitalization for BCH/USD stands at $4.10 billion.

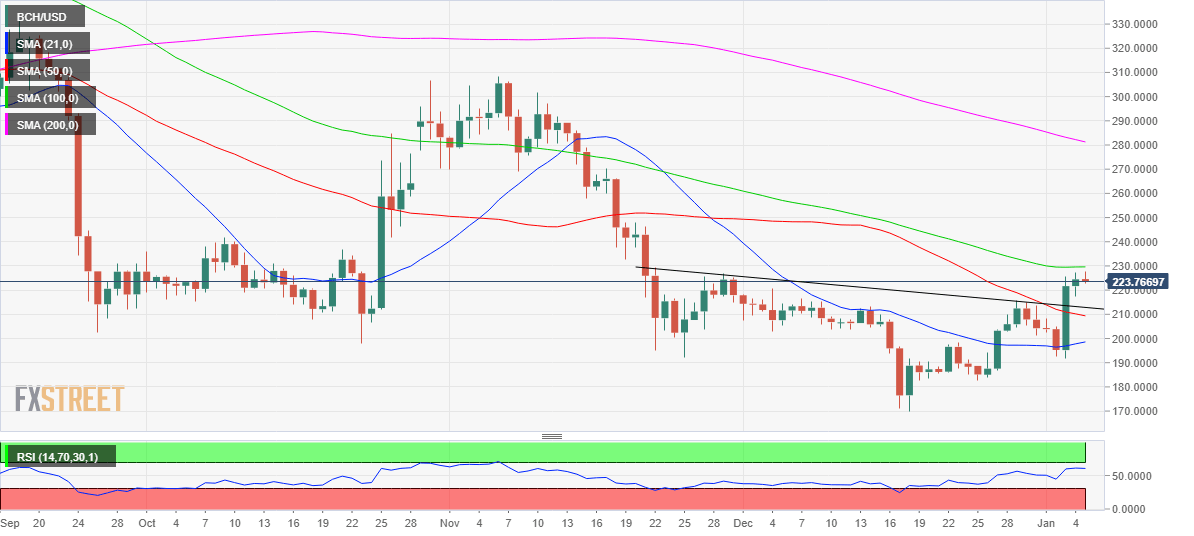
BCH/USD daily chart

An inverse head and shoulders pattern was confirmed on the daily sticks last Friday after the price broke above the neckline placed near 213 levels. The pattern is usually seen as a bullish reversal after the BCH bulls staged a solid comeback from weekly lows of 191.77. Given the pattern validation, the No. 5 coin remains on track to conquer the pattern target of 262.95 over the coming weeks.

However, ahead of the aforementioned target, the bulls need to clear the immediate resistance aligned at the horizontal 100-day Simple Moving Average (DMA), now at 229.61. Only a daily closing above the last would give the much-needed impetus to the buyers, in order to extend the bullish momentum in the near-term.

A failure to take out the 100-DMA hurdle, the sellers could regain control knocking-off the rates back to the now resistance-turned-support of the pattern neckline. The next support awaits at the bearish 50-DMA of 209.35, which could slow the pace of declines. Meanwhile, the horizontal 21-DMA support at 198.50 is the key level to beat for the bears further south.
BCH/USD Levels to watch

BCH/USD

Overview
Today last price223.745
Today Daily Change-0.9553
Today Daily Change %-0.43
Today daily open224.4593
 
Trends
Daily SMA20197.3374
Daily SMA50210.185
Daily SMA100229.4434
Daily SMA200283.1483
 
Levels
Previous Daily High227.1968
Previous Daily Low217.1641
Previous Weekly High225.7353
Previous Weekly Low191.7762
Previous Monthly High220.5853
Previous Monthly Low170.0256
Daily Fibonacci 38.2%223.3643
Daily Fibonacci 61.8%220.9966
Daily Pivot Point S1218.6833
Daily Pivot Point S2212.9074
Daily Pivot Point S3208.6506
Daily Pivot Point R1228.716
Daily Pivot Point R2232.9728
Daily Pivot Point R3238.7487

Author

Dhwani Mehta

Dhwani Mehta

FXStreet

Residing in Mumbai (India), Dhwani is a Senior Analyst and Manager of the Asian session at FXStreet. She has over 10 years of experience in analyzing and covering the global financial markets, with specialization in Forex and commodities markets.


More from Dhwani Mehta
Share:

Editor's Picks

XRP approaches key support as risk-off sentiment deepens
Ripple (XRP) is trading at $1.06 on Monday, maintaining its position within a broader bearish trend. The token’s technical outlook continues to deteriorate, pressured by declining retail participation. Appetite for risk assets remains lethargic, as reflected in the Fear & Greed Index, which is embedded in the Fear territory at 28.
Crypto Today: Bitcoin, Ethereum, XRP extend decline amid renewed risk-averse sentiment
The cryptocurrency market remains weak on Monday, with Bitcoin (BTC) falling toward the nearest $62,000. Ethereum (ETH) and Ripple (XRP) reflect the sell-off across altcoins, edging lower toward $1,800 and $1.05, respectively. Risk appetite remains subdued, as the Fear & Greed Index holds steady at 28, deep within Fear territory.
The Bitcoin futures yield collapse: Once over 20%, now less than Treasury notes
Once a goldmine for carry traders, Bitcoin futures have flipped, consistently underperforming plain‑vanilla U.S. Treasuries every month since February. Carry trades consistently yielded 20% or more across regulated and unregulated crypto exchanges during the 2021 bull market. The strategy involved shorting Bitcoin futures while simultaneously buying a spot exchange-traded fund (ETF).
The crypto market is moving in the opposite direction to equities
The crypto market’s market capitalisation has fallen by 1% over the past 24 hours, returning to levels last seen in mid-July. The positive momentum the market showed in the first half of last week failed to take hold. Once again, we are seeing a negative correlation with the Nasdaq 100 index, this time in the form of falling cryptocurrencies while shares rise. Could this be becoming the new norm?
Bitcoin: Bulls hold the line
Bitcoin (BTC) edges slightly lower, trading at $64,300 at the time of writing on Friday but holding firmly above a key support zone. US-listed spot Bitcoin Exchange Traded Funds (ETFs) support BTC as they continued to attract institutional flows through Thursday, pointing to the fourth consecutive week of net inflows.