Bitcoin Cash price analysis: Bullish flag pattern breakout gets a shot at $170
- Bitcoin Cash is the bull among the bears.
- It is likely that Bitcoin Cash will slide back below $170.

Bitcoin Cash is among the few coins hanging in the green following a breakout from a bullish flag pattern that was formed after the price was rejected from trading above $200. Bitcoin Cash buyers have been intent on ensuring that they keep the token at higher levels including drawing the line in the sand at $140.
Apart from Bitcoin Cash and IOTA (MIOTA), all the other assets in the top twenty are in the red. Bitcoin recovered past $3,900 but slipped back into the $3,800 range. Ethereum performed relatively well yesterday. Ripple’s XRP, on the other hand, is unable to correct above $0.4. However, the market is relatively stable; it has added $1 billion in the last 24 hours to stand at 4133 billion.
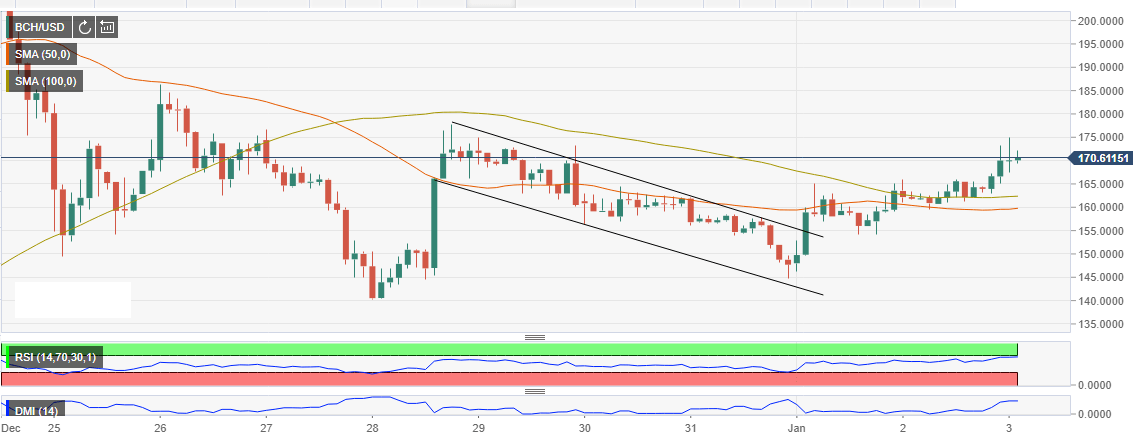
The bullish move that occurred after the bullish flag pattern corrected above the 50-period simple moving average (SMA) and the 100-period SMA on the 2-hour timeframe chart. BCH/USD continued with the upside corrected overcoming the resistance at $160. The asset has attacked the next resistance at $170, although the bulls lack momentum to not only retrace further but also sustain the price above this level. Therefore, according to the technical indicators, it is likely that Bitcoin Cash will slide back below $170. At the same time, buying activity is still high and sideways trading will take effect from now heading into the next sessions of the day.
BCH/USD 12’ chart
Get 24/7 Crypto updates in our social media channels: Give us a follow at @FXSCrypto and our FXStreet Crypto Trading Telegram channel
Author

John Isige
FXStreet
John Isige is a seasoned cryptocurrency journalist and markets analyst committed to delivering high-quality, actionable insights tailored to traders, investors, and crypto enthusiasts. He enjoys deep dives into emerging Web3 tren


