Bitcoin Cash market overview: BCH/USD stalls short of $170- Rising wedge pattern spotted
- The hurdle at $170 is proving to be an uphill task among the bulls.
- Reaction to the sideways trendline could send Bitcoin Cash back to the drawing board.
- BCH/USD likely to stay in range with the upside limit at $170.

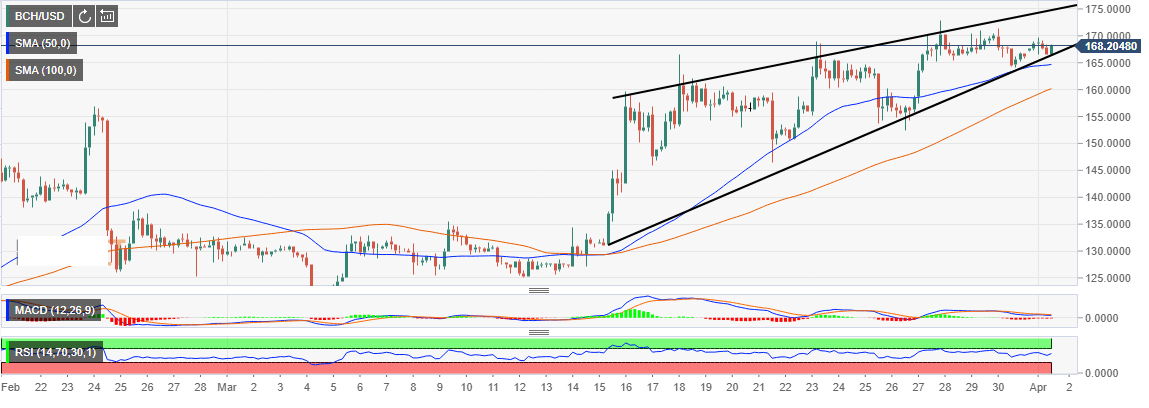
Bitcoin Cash has been trending higher within a rising wedge pattern, 4-hour chart. The price has in the last two weeks traded higher highs and higher lows above the lower trendline of the wedge pattern. BCH/USD recently cleared the resistance at $160 and $170, however, the buyers failed to sustain growth above $170.
Since March 28, the trend has been sideways between $165 and $170. The hurdle at $170 is proving to be an uphill task among the bulls but the good thing the downside has been strongly supported. According to the 4-hour chart, the rising trendline is the initial support followed by the 50 SMA and the 100 SMA currently at $165 and $160 in that order.
A weak momentum is building towards the wedge pattern resistance. It is important that the bulls extend gains above $170 in the short-term in order to sustain the uptrend. However, since a rising wedge pattern is a bearish pattern, a break under its support could translate into further breakdown towards $120 primary support.
Meanwhile, the technical indicators hint a price consolidation move. As long as the immediate support at $165 can continue to hold ground, BCH/USD will stay in range with the upside limit at $170.
BCH/USD 4-hour chart
Get 24/7 Crypto updates in our social media channels: Give us a follow at @FXSCrypto and our FXStreet Crypto Trading Telegram channel
Author

John Isige
FXStreet
John Isige is a seasoned cryptocurrency journalist and markets analyst committed to delivering high-quality, actionable insights tailored to traders, investors, and crypto enthusiasts. He enjoys deep dives into emerging Web3 tren