Bitcoin bull flag and fibonacci offers trading ideas
-
Bitcoin (BTC/USD) has tested and bounced upwards from the 21 ema support zone. We will review when the uptrend is expected to fully return.
-
The main question is whether BTC/USD has already completed its wave 4or not. This will determine whether Bitcoin could offer more bearish pullback or a bullish breakout
-
Price action needs to break below the 21 ema support zone to potentially start 5 bearish waves down. This could complete a wave C (grey) of wave 4 (pink)

This article will also analyse the key Fibonacci levels and potential discounts within the uptrend.
Price Charts and Technical Analysis
-
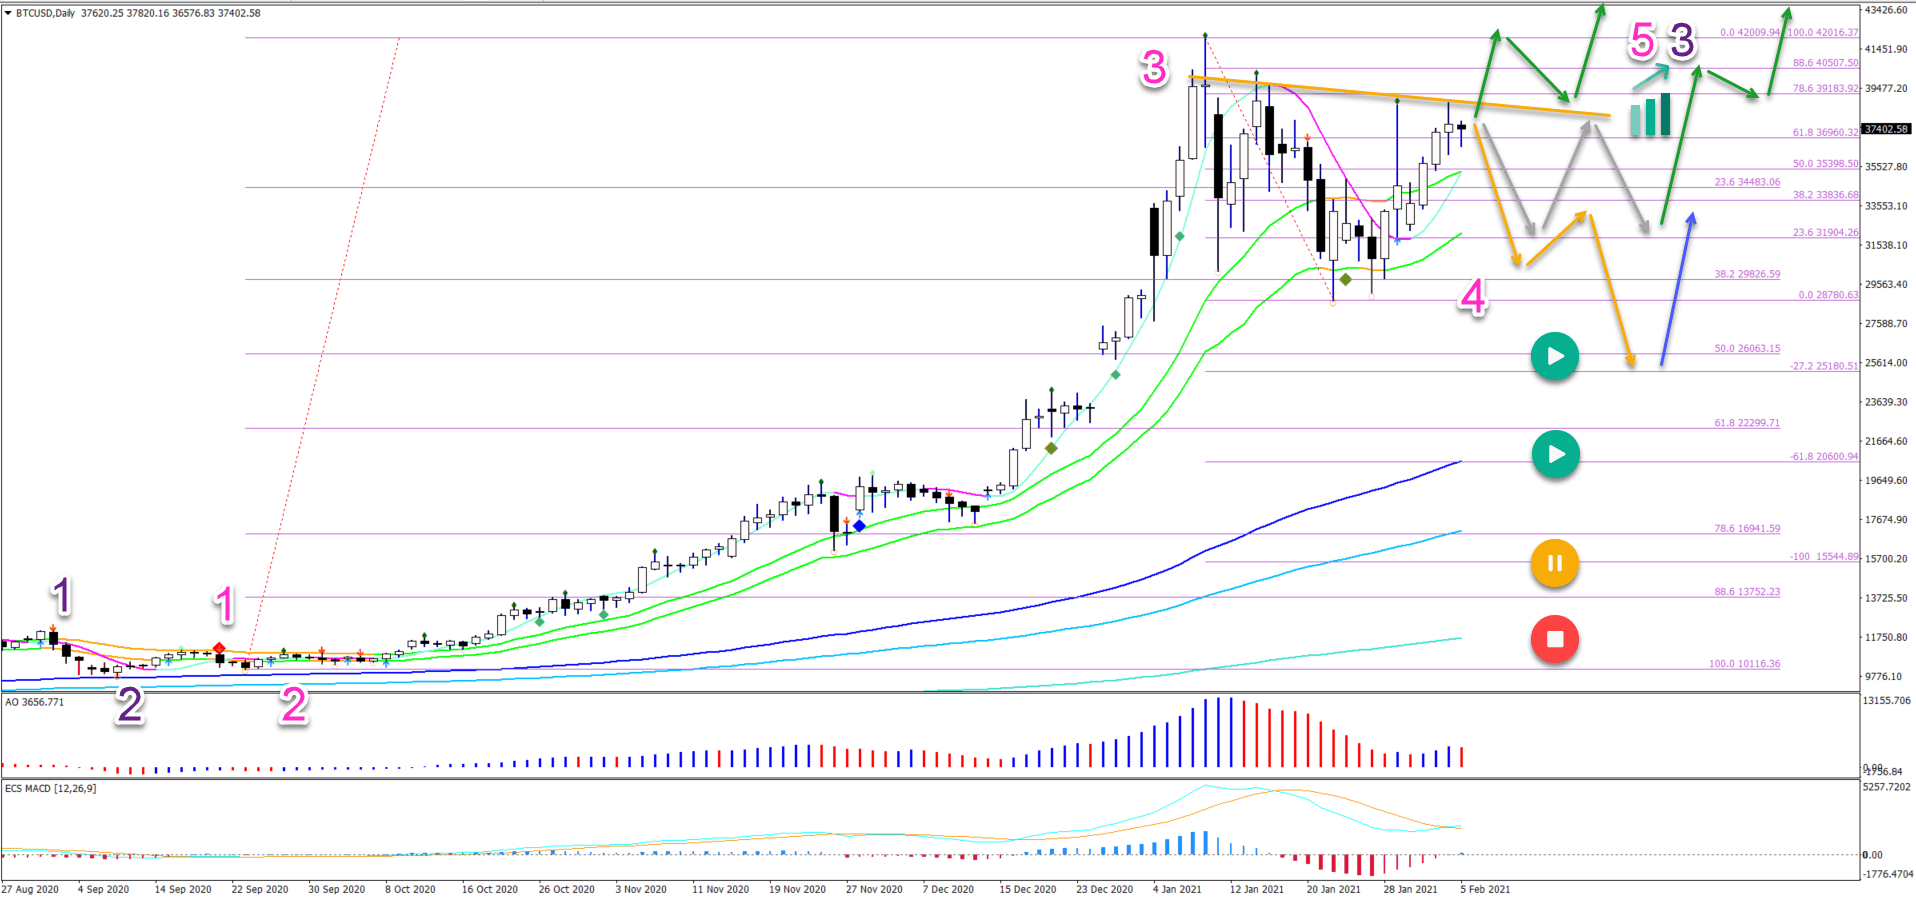
A bullish breakout above the resistance trend line (orange) followed by a bull flag chart pattern is increasing the odds of an immediate uptrend (green arrows).
-
A bearish bounce, however, could indicate an ABCDE triangle chart pattern (grey arrows) which is expected to break up (green arrows).
-
A bearish bounce could also create a larger retracement to the lower Fibonacci retracement levels like 50-618% Fibs. A bullish bounce is expected at this support (blue arrows).
The uptrend remains intact as long as price action remains above $20,000. A deeper push lower, however, would place the bulls under pressure (yellow and red circles).
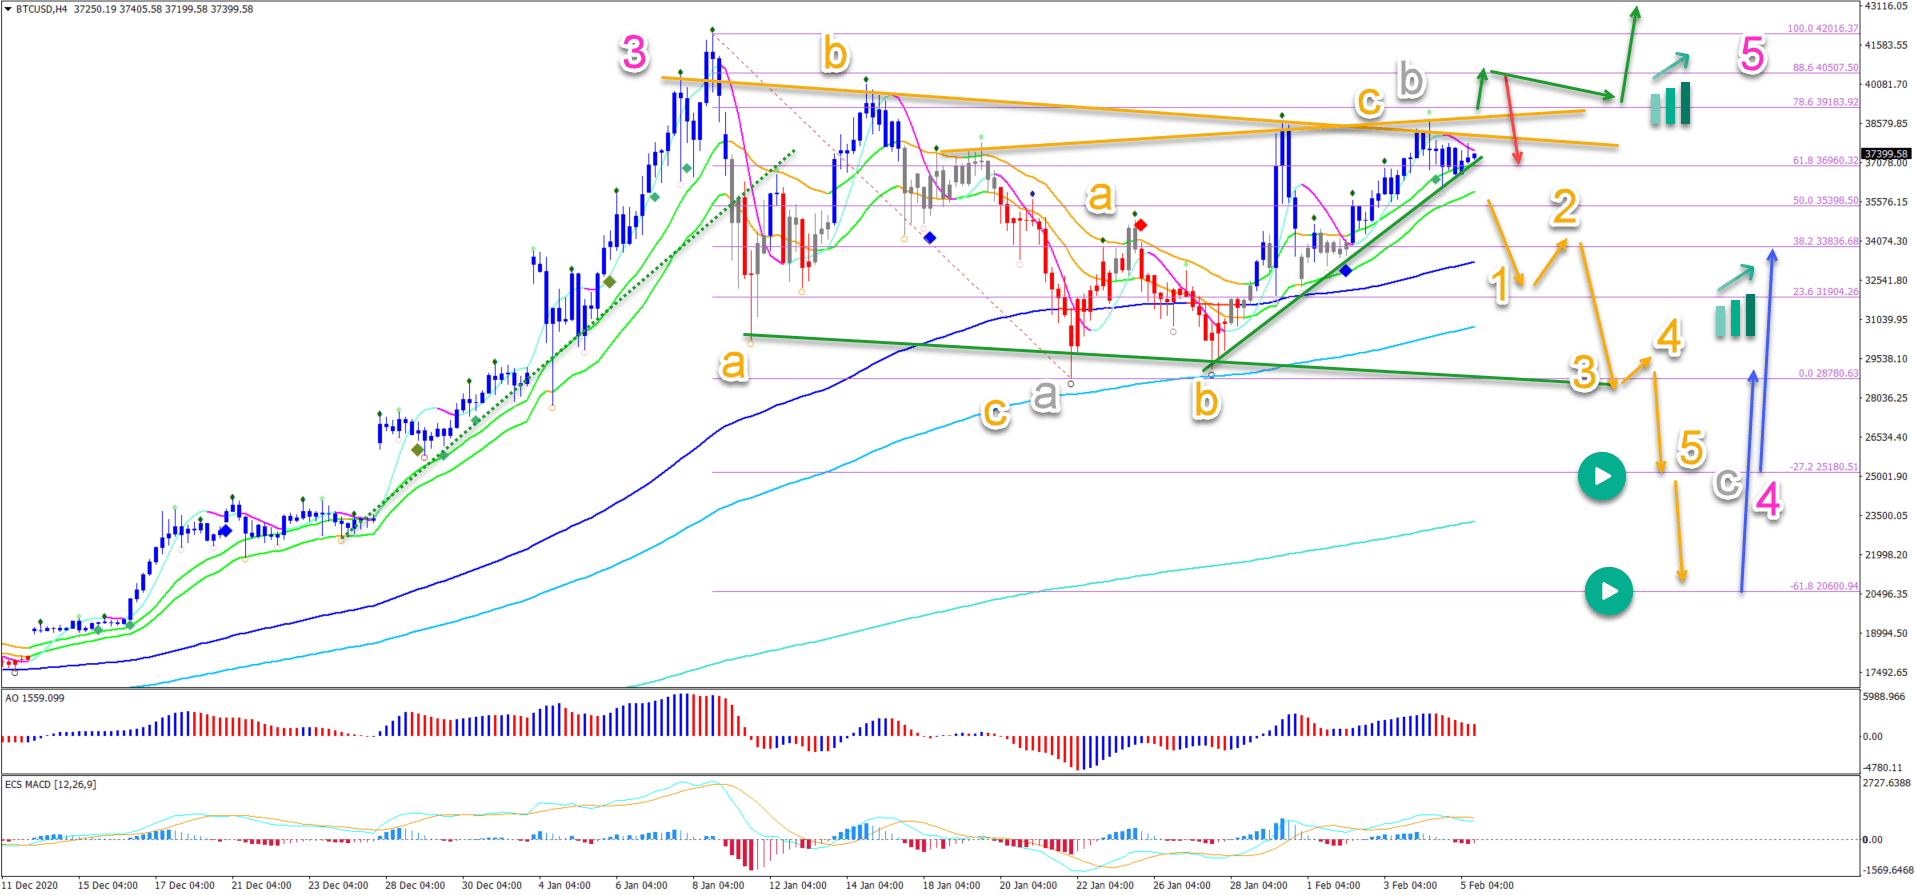
On the 4 hour chart, price action needs to break below the 21 ema support zone to potentially start 5 bearish waves down (orange). This could complete a wave C (grey) of wave 4 (pink). The Fibonacci levels are expected to act as support (blue arrows).
An immediate breakout could take place too (green arrows) above the bull flag chart pattern (orange and green lines). Although the Fibonacci resistance could spark a downside momentum as well (red arrow).
Price patterns remain key after any breakout to confirm the breakout direction or indicate a false breakout.
The main target for the upside is currently around the $50,000 round level.
The analysis has been done with the ecs.SWAT method and ebook.
Author

Chris Svorcik
FS method
Chris Svorcik is a trader, analyst, and educator with over 15 years of experience in financial markets, specializing in moving averages, market structure, and price patterns.


