Bitcoin (BTC/USD) returns to 17106 - 16986 supply zone in the intraday chart

The crypto currency benchmark BTC/USD returns to a familiar zone - 17106-16986 supply zone.
BTC/USD has struggled to hold since the beginning of November 2022, as indicated on the attached chart. Only one breakthrough lifted prices to the 17994 - 17873 zone but failed to continue and pulled back below 17106-16986.
The recent move from the 16000 - 16220 area has created some hope among technical traders; this could be the final run to break the barrier, but it remains to be seen as BTC/USD consolidates at the time of writing. The price consolidation will likely continue at 17106-16986 until it breaks and takes off or pulls back to the previous support zone indicated on the chart.
The weekly chart has a strong support zone at 15445-17160, an area I pointed out in my analysis in December 2021 when BTC/USD was at 40656.
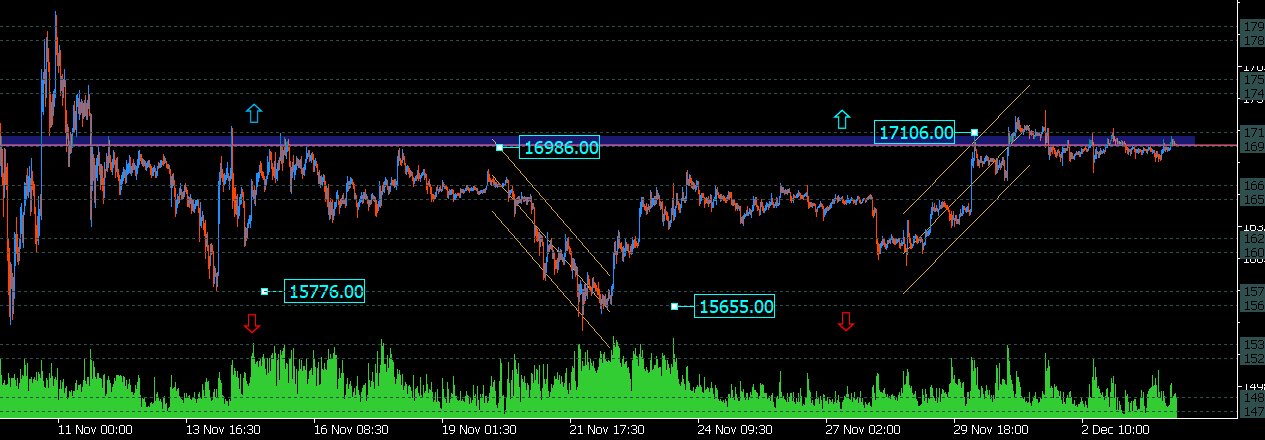
BTC/USD 30 minutes price chart 4/12/2022
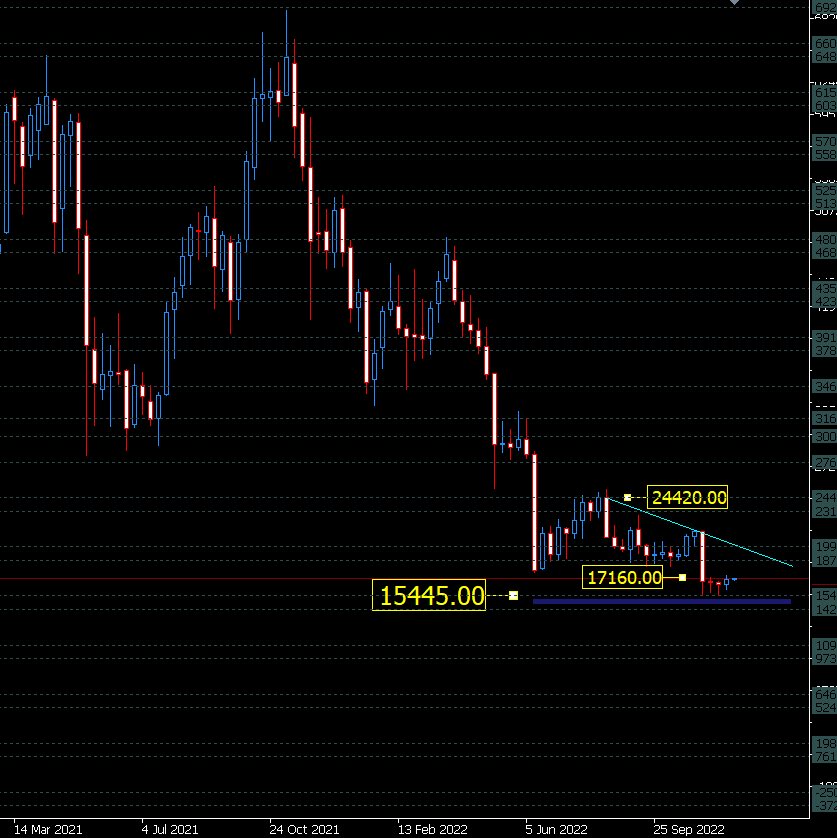
BTC/USD weekly price chart 4/12/2022
Author

Denis Joeli Fatiaki
Independent Analyst
Denis Joeli Fatiaki possesses over a decade of extensive experience as a multi-asset trader and Market Strategist.


