Bitcoin Breaks 7-Month Downtrend But Must Clear These Hurdles to $10K

The price of Bitcoin (BTC) found strong support at $8,200 last week, after which it started to rally toward $8,800 earlier today.
Alongside with that, the total market capitalization of crypto found a support at $215 billion and starting to look bullish. Will this mean that the correction is over, and crypto is trending upwards?

Crypto market daily performance. Source: Coin360
Bitcoin still in an uptrend since the low at $6,500
Bitcoin is still trending upwards since the low at $6,500, as previous resistance zones have become support. A recent example is showing a bounce on the green area, which is the $8,200 level. This type of bullish support/resistance flips is a common occurrence in an uptrend market.
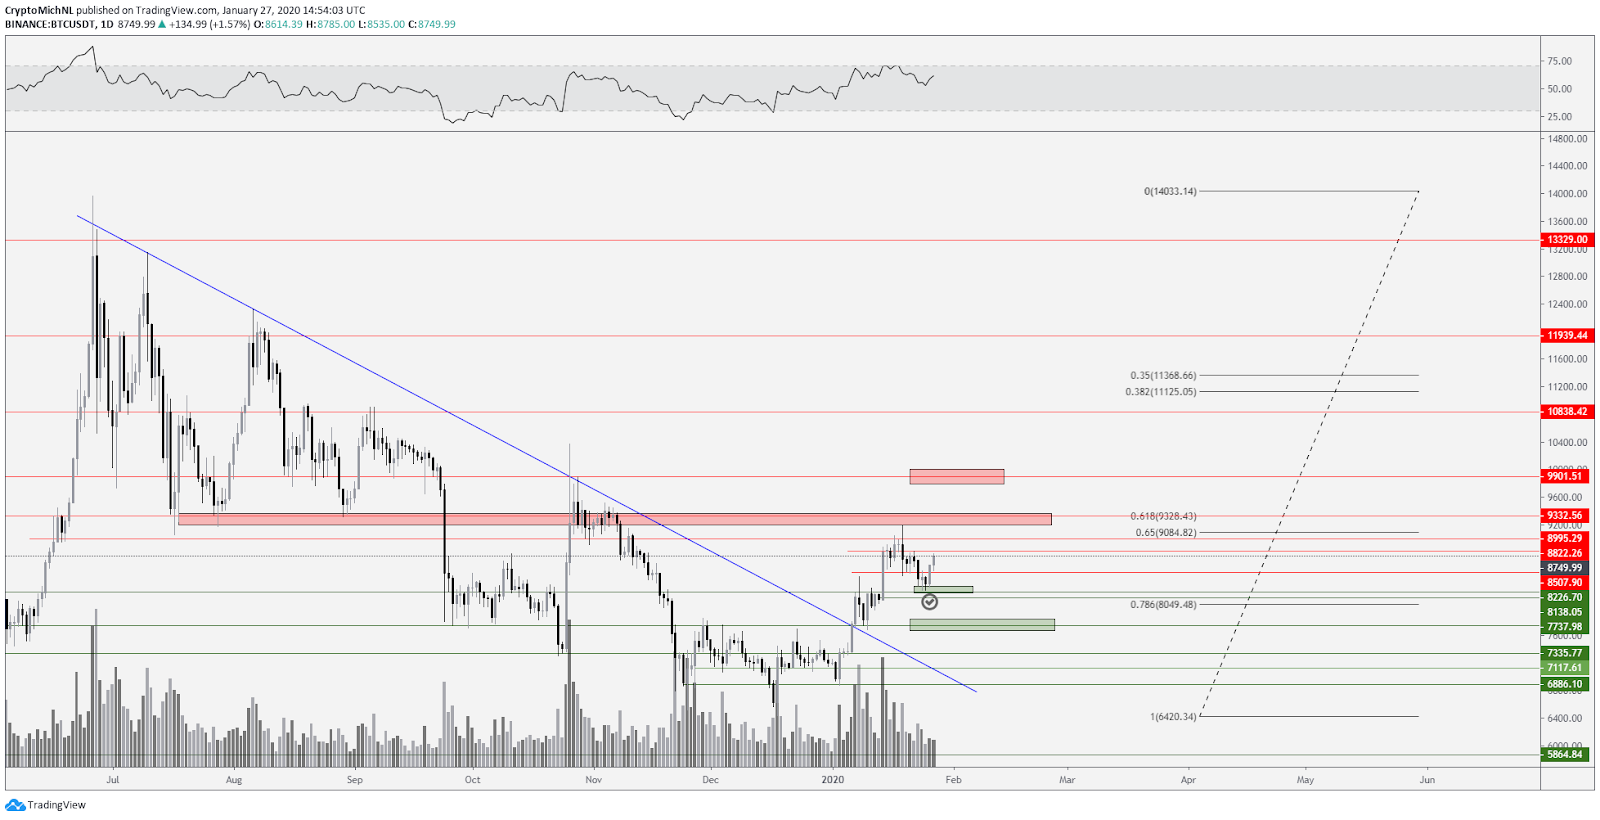
BTC USDT 1-day chart. Source: TradingView
A break below $8,200 would have demonstrated weakness, as that level would not have provided enough buying pressure and support. Losing such a level would usually have been followed by a continuation downwards. An example is found after the push to $10,000 in November 2019.
The chart is also showing a clear breakout from the 7-month downtrend. A retest was done at $7,600, after which the price of Bitcoin rallied towards $9,200 for temporary resistance.
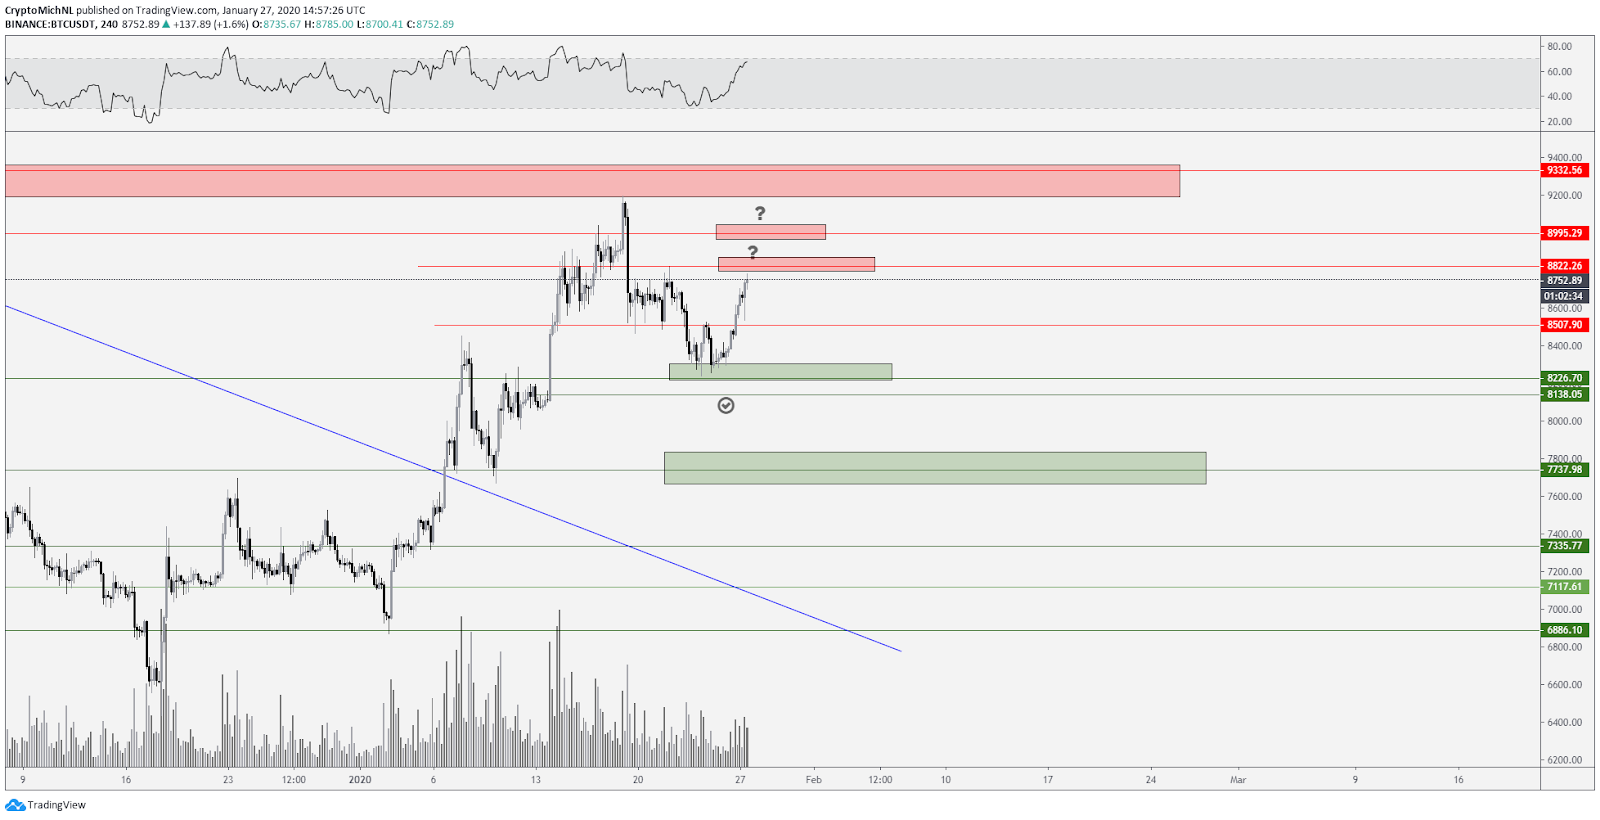
BTC USDT 4-hour chart. Source: TradingView
The 4-hour chart of Bitcoin is showing a healthy support/resistance flip at $8,200, after which price broke through the $8,500 resistance. Currently, the price of Bitcoin is facing the next resistance at $8,800.
However, it’s quite unlikely to see an immediate breakthrough at this level as the indicators on smaller time frames show exhaustion of this upwards move.
Additionally, some significant resistances are shown on the chart, i.e. $9,000 and $9,200-9,400, which are two hurdles to overcome if the price of Bitcoin wants to continue moving upwards.
On the support side, a retest of $8,500 looks quite healthy for confirmation of new support. Range-bound movements are now likely to happen if price can’t break through $8,800 or drop below $8,500.
Total market capitalization flips a crucial level for support

Total market capitalization cryptocurrency chart. Source: TradingView
The total market capitalization of cryptocurrencies is showing an essential bounce from the blue zone (level around $217-218 billion). A retest there was quite healthy as anticipated in a recent article.
This retest is now completed and shows intense buying pressure as the total market capitalization has already rallied up to $238 billion. This retest also indicates confirmation of the uptrend with the total market cap breaking the 7-month downtrend as well.
The first hurdle to overcome now is the $247 billion level. If that is broken, continuation towards $270 and $300 billion is likely to occur.
Altcoins showing more strength than Bitcoin
The total market capitalization chart of altcoins is looking healthy The market cap rallied from $52 billion to $80 billion. Only a slight retracement occurred to $71 billion, which means that it is stuck in a narrow range.
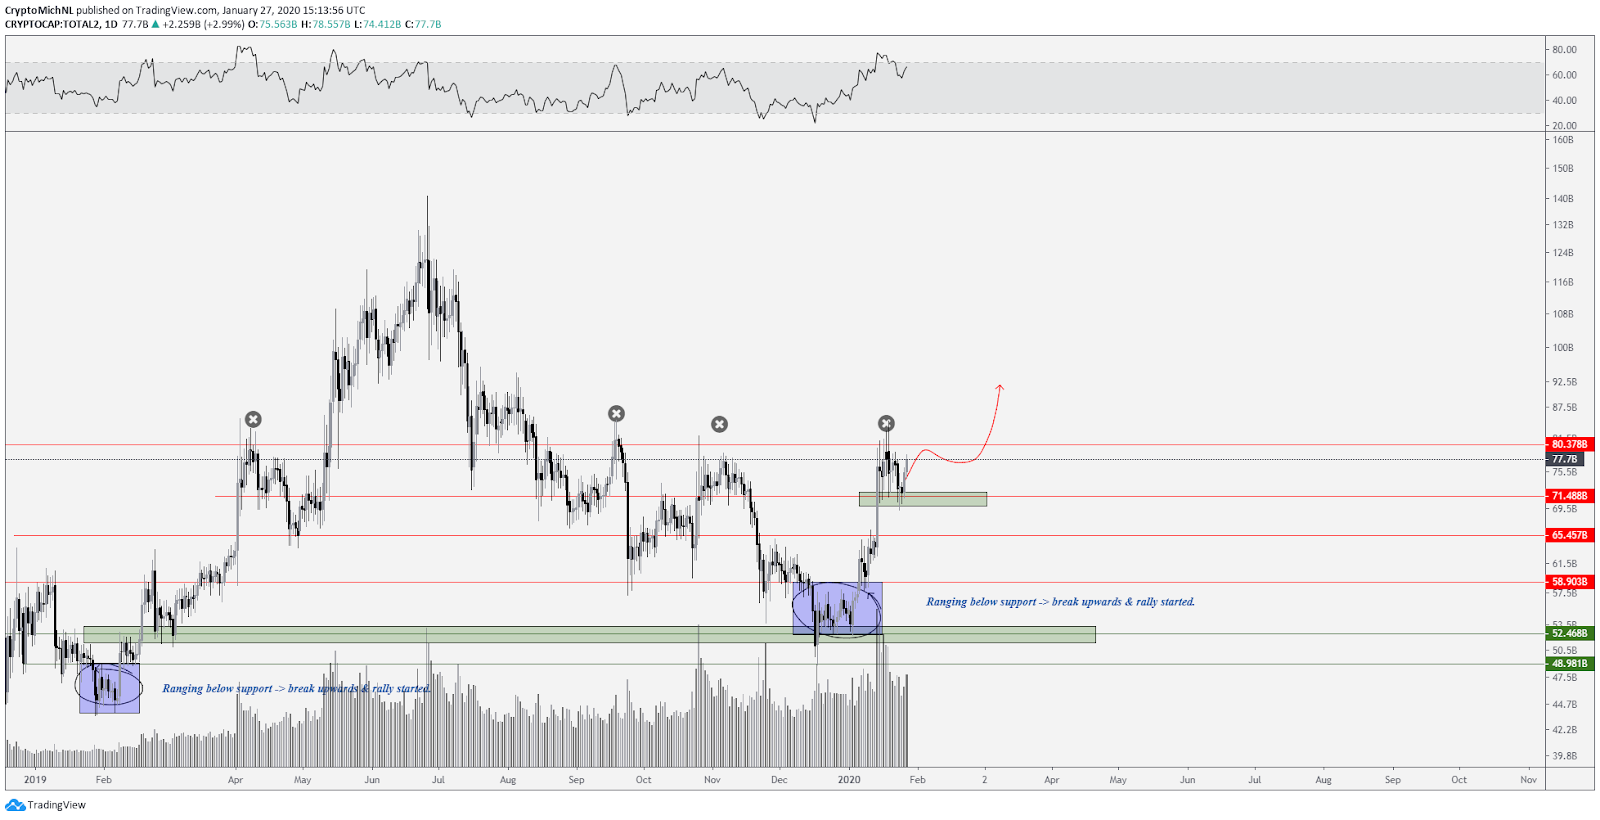
Total altcoin market capitalization chart. Source: TradingView
If we check the rest of the chart, we can spot many tests of the $80 billion level in recent months. Around three tests have happened prior to this latest one, which means that the resistance should become weaker.
Remember, the more times a resistance gets tested, the more exhausted sellers will get, and the weaker a resistance becomes. On the other hand, this also happens with support zones. The $6,000 support of Bitcoin in 2018 was tested many times before it broke down.
Given that these tests of the $80 billion level occurred quite frequently, a breakout to the upside is the most likely scenario at this point, meaning that the altcoin market cap could rally towards $120 billion.
The bullish scenario for Bitcoin

BTC USDT 4-hour chart bullish scenario. Source: TradingView
The most bullish scenario would be a clear breakout of $8,800 and a continuation from there. However, as stated earlier, I find it unlikely to see such a move occur in one go.
A retest and consolidation would be more likely including a likely retest of the $8,500. This is healthy and would be almost required before the price of Bitcoin can continue to face higher resistance levels.
If Bitcoin can hold the $8,500 area for support, I see a breakthrough of the $8,800 and $9,000 as likely, after which $10,000 will become the primary target. Moreover, clearing $10,000 could bring the price of Bitcoin towards $11,000 as well.
The bearish scenario for Bitcoin
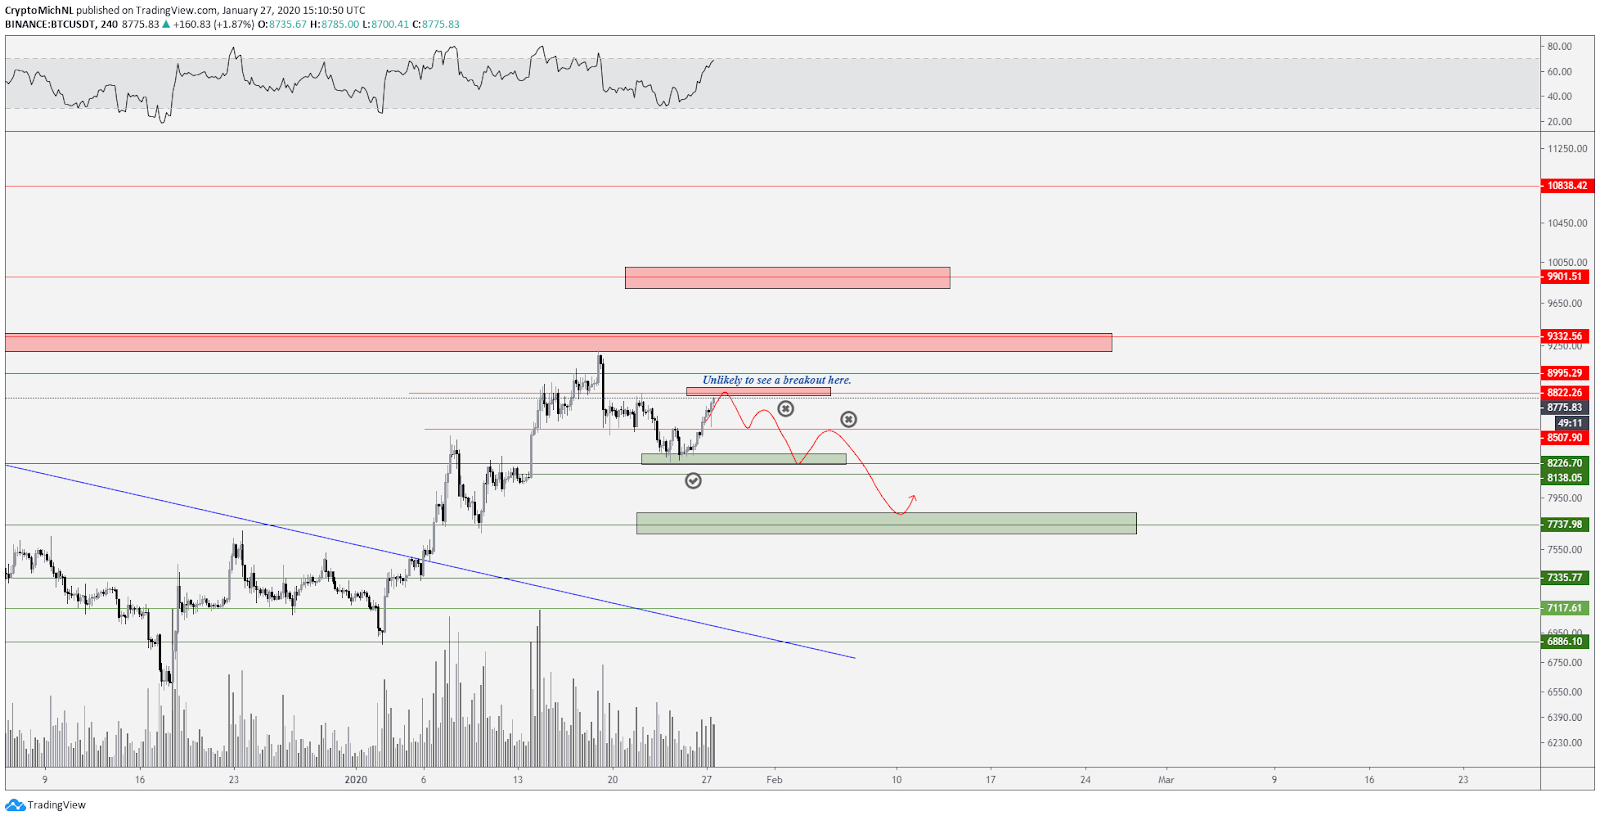
BTC USDT 4-hour chart bearish scenario. Source: TradingView
Typically, the bearish scenario has a similar pattern in the beginning, as BTC needs to be rejected at the $8,800 level. However, the difference is in the subsequent pattern.
If the price of Bitcoin is to make lower highs with weak bounces, the downward trend is likely to resume. If this occurs, I’d be aiming for bearish retest (support/resistances flips) of the $8,500 level as a potential short opportunity. The main target would then be the $7,600 area.
But first, the price needs to be rejected at $8,800-9,000 to get these scenarios going. Overall, the $8,100 support/resistance flip doesn’t say that we’re bearish at this point. Especially, since that price has broken at a 7-month downtrend.
Author

Cointelegraph Team
Cointelegraph
We are privileged enough to work with the best and brightest in Bitcoin.


