Bitcoin awaits breakout as bulls test $60k high again
-
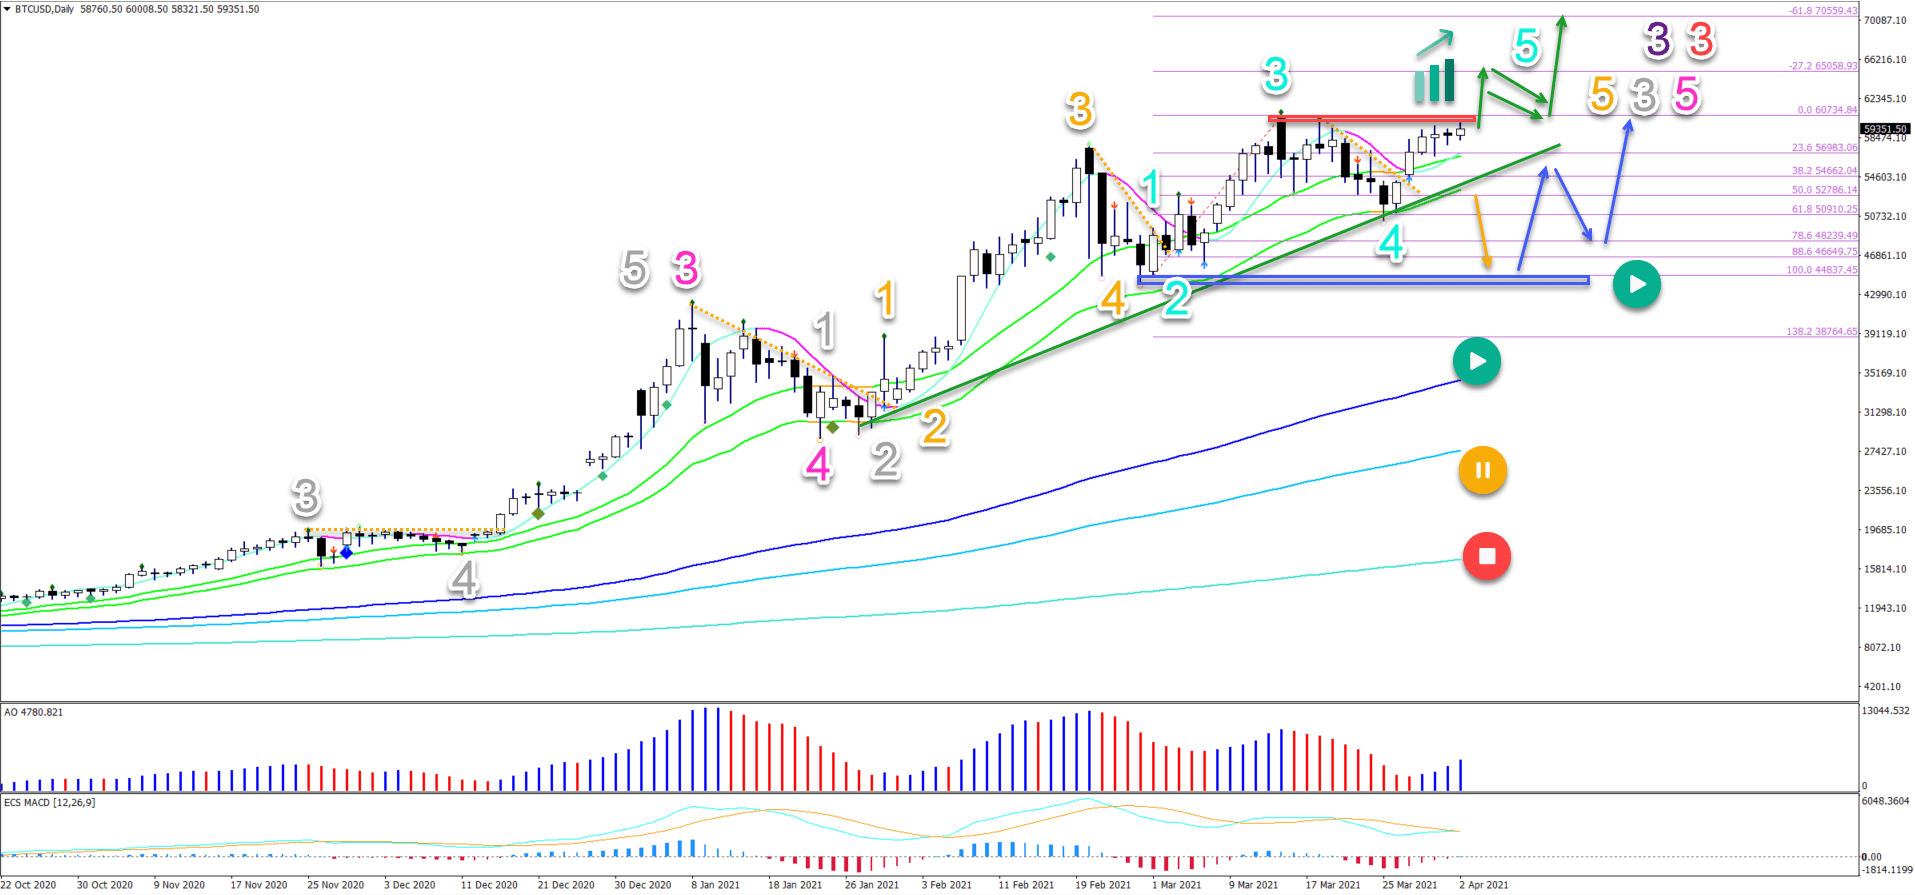
Bitcoin (BTC/USD) uptrend is slowing down with corrective price action in the past few weeks. But another bullish bounce this week is challenging the previous top.
-
BTC/USD price patterns indicate that the uptrend is still active and far from completed. The choppy price action, however, does point to a wave 4 pattern.
-
A bullish bounce at the support zone would solidify the uptrend. The main bullish targets are the -27.2% and -61.8% Fibonacci levels at $65k and $70k for the moment.

Will price action finally break the $60,000 resistance and continue for a new higher high?
Price charts and technical analysis
The BTC/USD price patterns indicate that the uptrend is still active and far from completed. The choppy price action, however, does point to a wave 4 pattern. Let’s review the key decision zones:
-
The resistance at the previous top is critical. A bullish breakout (green arrows) could confirm the immediate uptrend continuation.
-
A bull flag pattern after that breakout is also key. A retest of the broken resistance and $60k level could take place via a flag pattern. A bullish bounce at the support zone would solidify the uptrend.
-
The main bullish targets are the -27.2% and -61.8% Fibonacci levels at $65k and $70k for the moment.
-
If price action breaks down or if price action shows a false bullish breakout with a weak daily candlestick, then a deeper retracement could take place. A break below the 21 ema (orange arrow) could indicate a retest of the previous bottom (blue box). A bounce is expected at the support (blue arrow).
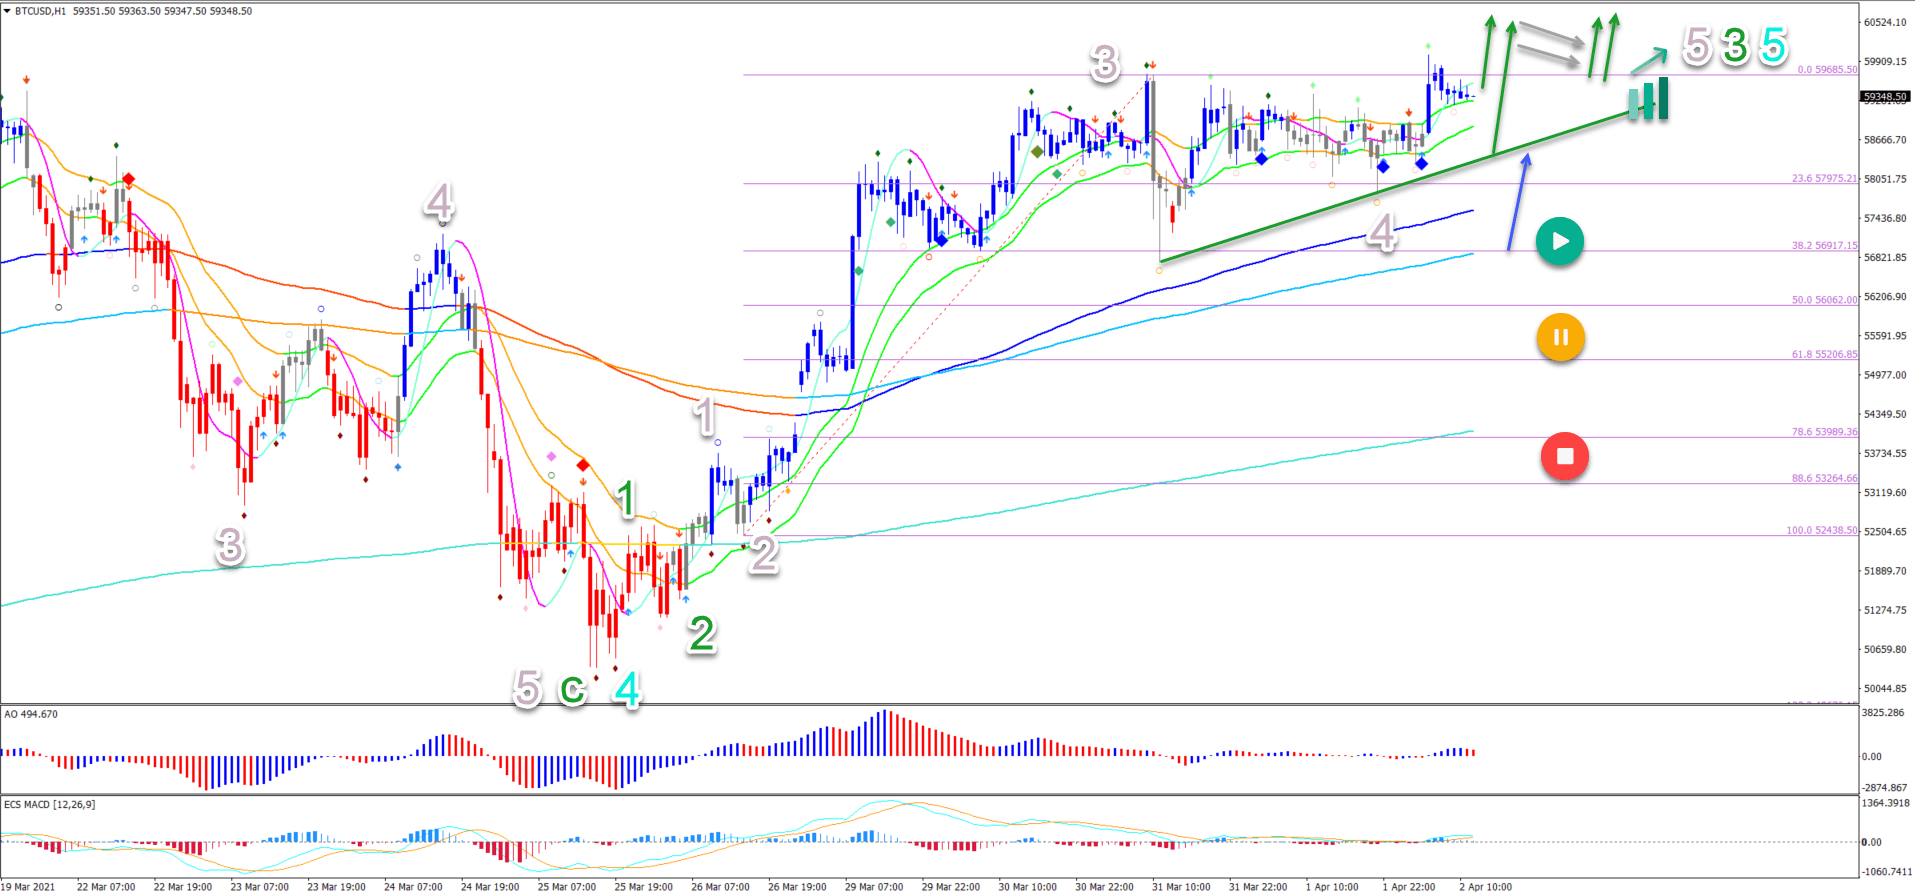
On the 1 hour chart, price action seems to have completed a wave C (green) within wave 4 (blue) at the most recent lowest low:
-
The quick impulsive bullish price swing is probably a wave 3.
-
The corrective and choppy correction is usual for a wave 4.
-
The wave 4 retracement respected the usual 38.2% Fibonacci level.
-
A bullish breakout or bounce (green arrows) could indicate a bullish move.
-
A break below the support line (green) means a retracement. The 38.2% Fib could hold and create a double bottom.
-
A break below the 50% Fib indicates a deeper retracement.
The analysis has been done with the ecs.SWAT method and ebook.
Author

Chris Svorcik
FS method
Chris Svorcik is a trader, analyst, and educator with over 15 years of experience in financial markets, specializing in moving averages, market structure, and price patterns.